
When Cash Equivalents Don’t Equal Cash
Analysis of the price volatility in “cash equivalent” ultrashort duration ETFs. Capital preservation tied to underlying portfolio composition and credit quality. Reevaluate your risk tolerance.

Analysis of the price volatility in “cash equivalent” ultrashort duration ETFs. Capital preservation tied to underlying portfolio composition and credit quality. Reevaluate your risk tolerance.

Right now market fear and volatility is hitting record highs. Uncertainty about the short-term effects of the pandemic and effects on economic and corporate earnings growth is driving the market. It’s precisely for times like these that a diversified, and properly risk-managed portfolio is essential. These will allow you to ride out the bear market without selling quality stocks.

As long-term dividend growth investors, we are best served to take the long-term view and ride the short-term volatility out. I am confident that we are going to see fundamental deterioration over the short run as a result of the fear that the coronavirus has instigated. FAST Graphs Friday analyze Out Loud Video.

A long, drawn out note to investors who may not have been sleeping so well lately…

With this article, I will attempt to illustrate what I believe is a more rational way to evaluate how well your stocks are performing. Good companies that have been overvalued for a long time, could become reasonable or even cheap again. FAST Graphs Friday Analyze out Loud Video: A Better Way to Measure Performance.
A brief overview of ESG investing. Example of how to obtain and analyze ESG information.

Part 3 of a series comparing dividend yield and growth. How long do companies remain dividend growers? How dividend reinvestment affects compounding returns.

Maintaining a positive mindset can go a long way towards warding off the fear, greed, and other negative emotions that cause investing pitfalls. Celebrate success; don’t demonize wealth. Be patient and disciplined and over time, anyone can create a meaningful passive income stream.
Part 2 of a series comparing dividend yield and growth. How dividend growth can decouple from earnings growth. How long can high growth be sustained? A look at long term historical dividend growth rates.

Should you focus on higher yield or higher growth? A comparison of strategies and how they can affect income and total return. The optimal strategy for you depends on your income needs and time frame.
Analysis of the price volatility in “cash equivalent” ultrashort duration ETFs. Capital preservation tied to underlying portfolio composition and credit quality. Reevaluate your risk tolerance.
Right now market fear and volatility is hitting record highs. Uncertainty about the short-term effects of the pandemic and effects on economic and corporate earnings growth is driving the market. It’s precisely for times like these that a diversified, and properly risk-managed portfolio is essential. These will allow you to ride out the bear market without selling quality stocks.
As long-term dividend growth investors, we are best served to take the long-term view and ride the short-term volatility out. I am confident that we are going to see fundamental deterioration over the short run as a result of the fear that the coronavirus has instigated. FAST Graphs Friday analyze Out Loud Video.
A long, drawn out note to investors who may not have been sleeping so well lately…
Welcome to the third installment in this series on evaluating investments featuring higher dividend yield or higher dividend growth. In case you missed my previous articles, in Part 1, we discussed the theoretical math and the tradeoffs between higher yield and higher growth, concluding that a higher growth investment would take 20-30 years to catch up to a higher yield investment in terms of dividend income produced, but could outperform on a total return basis relatively quickly. In Part 2, we examined the long term dividend growth rates of various companies and how growth evolves over the lifetime of a company and across economic cycles. We concluded that it is possible for companies to sustain “high growth” (>10%) dividend increases over a span of 20-30 years, either naturally through earnings growth or artificially by manipulating their payout ratio. In today’s article, we’ll examine the longevity of dividend growth companies and how dividend reinvestment factors into the picture.
If you’re taking a long term view on investing, you’re likely planning to hold your investments for at least 5 years, and more likely, for decades to come. But what are the chances of a company actually surviving that long and maintaining its dividend growth streak?
The Great Recession was in many ways a once in a lifetime event, and many might consider a recession on a similar scale to be the “worst case scenario.” How did dividend growth companies fare? Looking at historical versions of the Dividend Champions list, we can see that of the 128 Champions (25+ year growth streak) at the end of 2008, only 98 survived with their growth streak intact by the end of 2009. In short, approximately a quarter of companies with established long term dividend growth were forced to cut or freeze their dividends due to the recession.
What about during “normal” times of economic expansion? To answer this question we will fast forward a year to the end of 2010, when the Dividend Champions list started tracking Contenders (10-24 years of growth) and Challengers (5-9 years of growth). Below I have tabulated the annual rates of removal of companies from the Dividend Champions list, due to dividend cuts, freezes, or mergers and acquisitions. (The Other category is due to currency fluctuations causing foreign company dividends to decrease in USD)
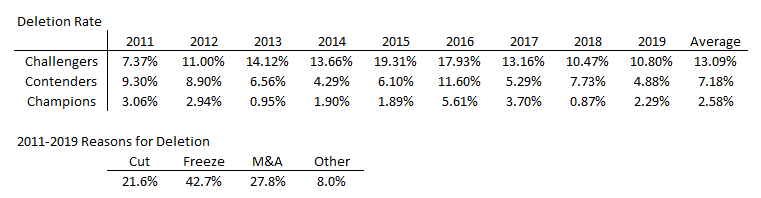
An important item to note is that due to the timeframe studied, we are looking at companies which grew their dividend through the Great Recession, implying some degree of financial health or resilience. (In order to make it onto the Challengers list in 2011, the company must have begun dividend growth in 2006 or earlier)
Looking at this data we can see some interesting patterns. There is a divergence in the deletion rate between Challengers, Contenders and Champions. This seems to imply that longer the dividend streak, the less likely it is for a company to fall off the list. This correlates well with the notion that companies which have been around longer tend to be more conservative and financially healthy.
What is surprising, however, is the rather high rate at which companies fall off the list of dividend growers, even in a growing economy. The table below shows the 5 year survival of various cohorts of companies.
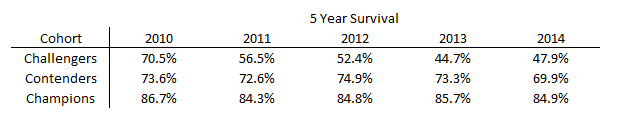
Looking at the numbers, only about half of the companies with a 5 year dividend growth streak will continue growing their dividends through year 10. If a 7% attrition rate holds true for all Contenders, then a company with a 10 year growth streak has about a 1 in 3 chance of making it to 25 years. For the Champions, a 2.5% attrition rate implies that only half of new Champions will make it to 50 years of growth.
Considering that it is basically a coin flip whether a dividend growth company will be around in 20-30 years, perhaps we should consider shortening our realistic investment holding period. This may shift the balance slightly in favor of higher yield investments.
Another topic we have not discussed so far is dividend reinvestment. Whether you choose to collect dividends in cash and direct the reinvestment or set your investments on an automatic dividend reinvestment program (NYSEARCA:DRIP), dividend reinvestment adds an additional layer of compounding to your investment returns.
Consider the case of the average dividend growth stock (3% yield, 7% growth):
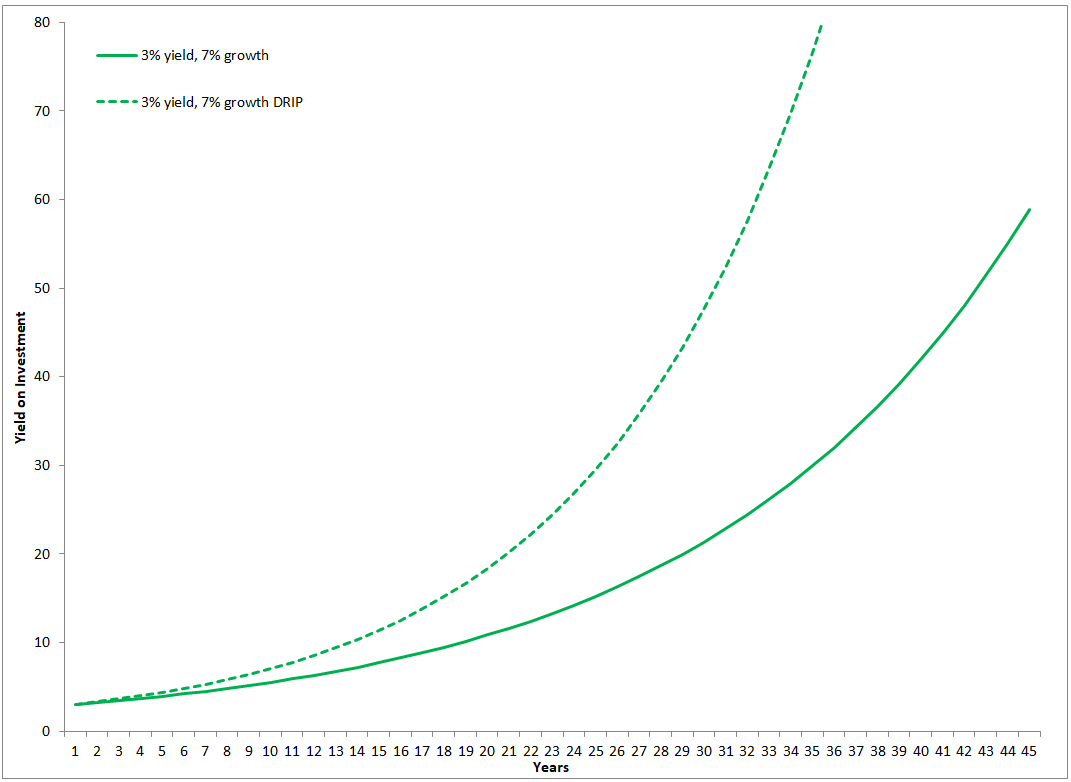
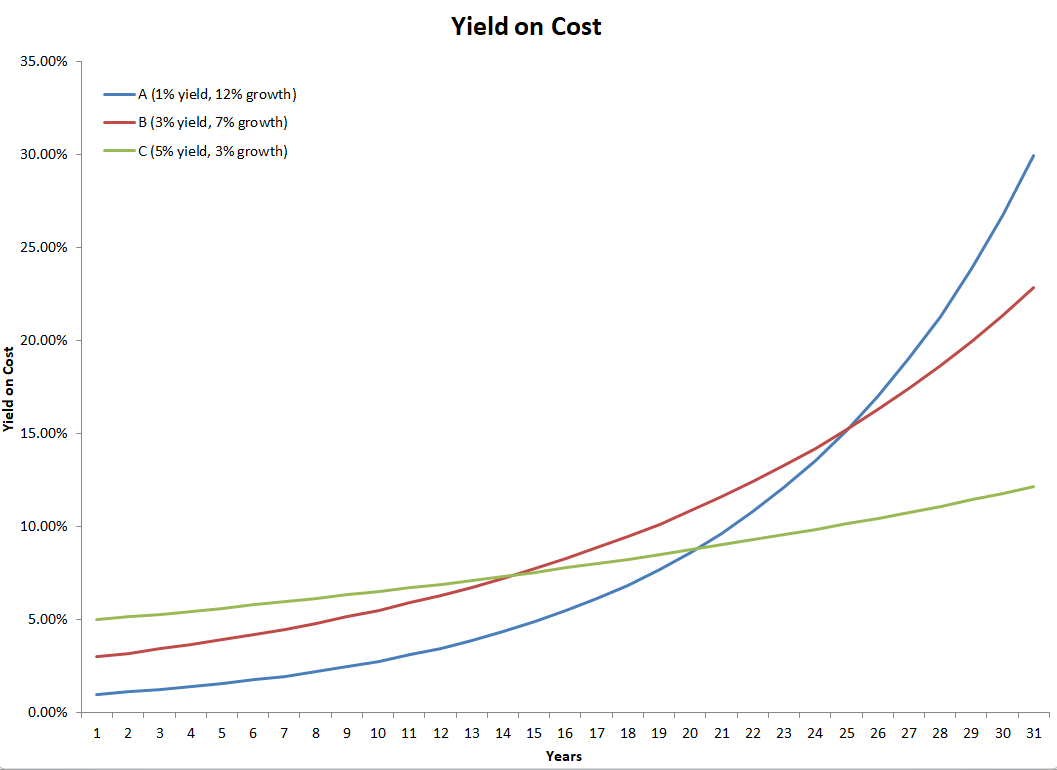
By year 30, the investment with dividends reinvested would generate more than twice as much income as the case where dividends were not reinvested. Now, obviously, unless an investor needs the dividend income for immediate expenses, there is very little reason to allow that cash to build up over a long time without reinvesting it. The question becomes how to deploy that cash in an effective manner. Many investors opt to use dividends received to purchase additional shares of the company which paid the dividend. This has interesting implications for our discussion on high yield vs high growth investments. If you recall, two weeks ago I showed this chart, which demonstrates how the dividend income can increase for various growth and yield scenarios. We saw breakeven times for annual dividend income of 14 years for average yield vs high yield, 20 years for low yield vs high yield, and 25 years for low yield vs average yield.
However, if you factor in dividend reinvestment, the chart changes drastically:

We now see breakeven times of 29 years, 37 years, and 42 years respectively. This shift makes sense conceptually as the high yield investment gives you more cash which allows the purchase of more shares early on in the investment period, increasing the time required for higher growth to catch up.
If you recall last week’s article, we discussed how the limits for sustained high dividend growth seemed to top out at 20-30 years, which suggests that it is possible that the high growth investment slows down and never catches up with the high yield investment.
Does this mean that investors should just stick to high yield investments? After all, if it takes 20-30 years to breakeven on a dividend income basis, and there’s a pretty good chance the company won’t be around, or continue growing its dividends at the same rate for the next few decades, why would anyone pick a high growth company? The answer lies in total return, where so long as growth stocks maintain their valuations, they will handily outperform high yield investments, even over short time frames. High yield investments also come with their own set of problems, as they tend to be in mature industries and investors must determine if the yield is sustainable over the long term.
At the end of the day, most investors will likely end up choosing a mix of high yield and high growth investments, providing a reasonable income stream while maintaining exposure to companies with high total return potential. Hopefully this series has helped you evaluate the role of each type of investment in your portfolio and understand the possibilities which may evolve over the lifetime of your investments.