Last week, I wrote an article looking at how a dividend growth investor might consider deciding between investments which feature higher dividend yield or higher dividend growth. In the article, I discussed how investors seeking income with a shorter time horizon are better off going for higher yield, while higher growth would eventually outperform when the time frame stretches beyond 20-30 years. However, as I briefly mentioned, such analysis was based on a set of assumptions that does not necessarily reflect reality, namely that: 1) the payout ratio does not change, 2) earnings/dividends grow at exactly the same rates in perpetuity, and 3) market valuation remains at the same multiple. Market valuations can vary greatly depending on sentiment, so we will exclude that from the discussion in this article.
Payout Creep
Let’s do a thought exercise. Consider the following metrics for two potential investments:
| A | B | |
| Sector | Consumer Discretionary | Consumer Discretionary |
| Industry | General Merchandise | General Merchandise |
| P/E | 17 | 17 |
| Yield | 0.82% | 2.76% |
| Forward Earnings Growth (1Y) | Mid-single digit | Mid-single digit |
| Trailing 5Y Dividend Growth CAGR | 14.90% | 20.80% |
Which one would you pick? I’m guessing B. Higher yield, and higher dividend growth, right?
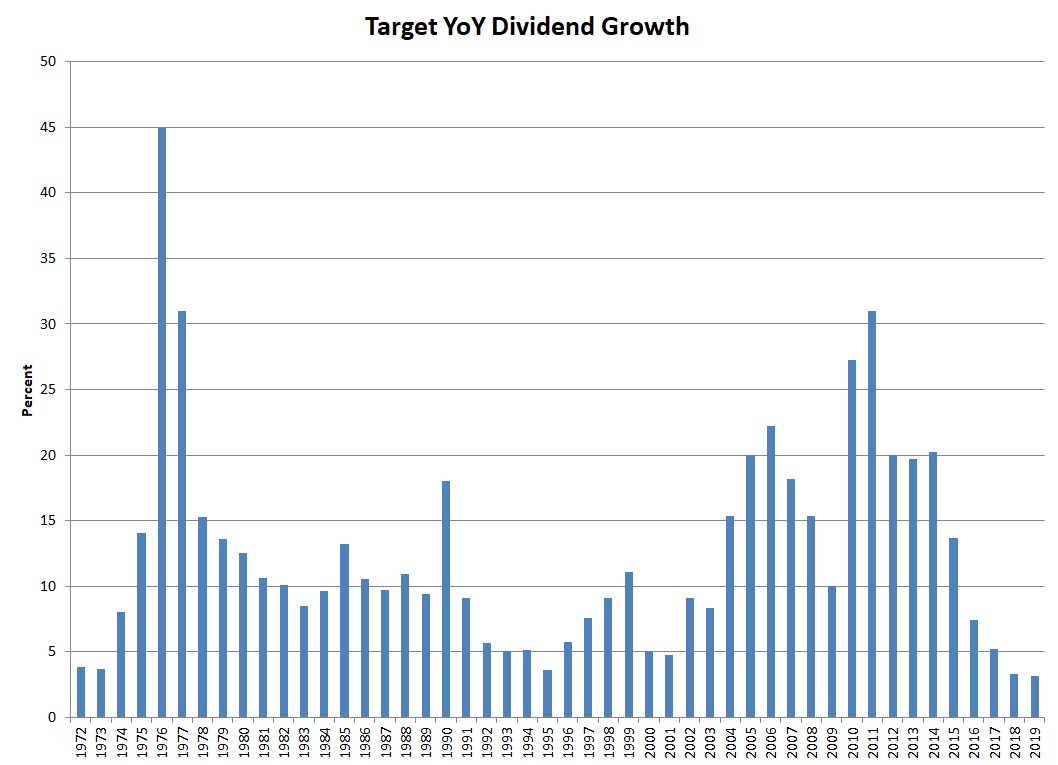
What if I told you these metrics were for the same company, separated by 10 years? In fact, the data reflects the realities of Target (TGT) in A) 2006 and B) 2016. (P/E and yield were approximate, but within realistic ranges)
If you had invested in A (2006), over the subsequent 5 years, you would have seen EPS grow by 42% and the dividend increase by 250% (and keep in mind there was the minor matter of the Great Recession in between).
Comparatively, if you had invested in B (2016), over the subsequent five years EPS would grow by 46% (based on current estimates for 2021). But, current estimates for the dividend in 2021 place it at only 26% above 2016 levels.


What gives? By all accounts, the company’s earnings growth profiles were similar in both periods. Yet dividend growth was drastically different. The key differentiator was that in 2006, Target was paying out only 14% of earnings while in 2016, the payout ratio had crept up to 47%. In the years prior to 2006, the payout ratio had been fairly steady, and the dividend grew in line with earnings. Subsequently, the company began raising its payout ratio, resulting in outsized dividend growth. In 2016, the reverse happened: the company had spent years rapidly increasing the dividend faster than earnings growth and subsequently deliberately limited dividend growth to reduce the payout ratio.
This example shows how changes in the payout ratio can cause dividend growth rates to diverge from the underlying fundamental performance of the company. It is important to remember that the dividend paid is a conscious decision on the part of management with regards to how much should be returned to shareholders. Changes in the dividend policy resulting in a different payout ratio can inflate (or deflate) the rate of dividend growth relative to the company’s earnings performance. One should not extrapolate historical growth rates into the future without taking into consideration the conditions in which such growth was attained and whether it is expected to continue.
The Law of Large Numbers
Our second major assumption was that growth can be sustained at the same rate in perpetuity. Obviously there will be year to year fluctuations due to economic conditions, but realistically, how long can a company stay in “high growth” mode?
One of the problems with growth is that the larger you get, the harder it is to keep growing at the same rate. Consider a company with a dividend of $1 per share. The next year, it increases the dividend by $1. Yay! 100% growth! The following year, it increases by another $1 to $3. 50% growth! Stellar! The next year, another $1. 33% growth. Then 25%. Then 20%. Pretty soon, another dollar of dividend growth will barely move the needle. Such is the law of large numbers.
Unfortunately, there are very few examples of companies with yearly sustained high dividend growth (>10% over decades). One example I was able to identify is Walmart (WMT):
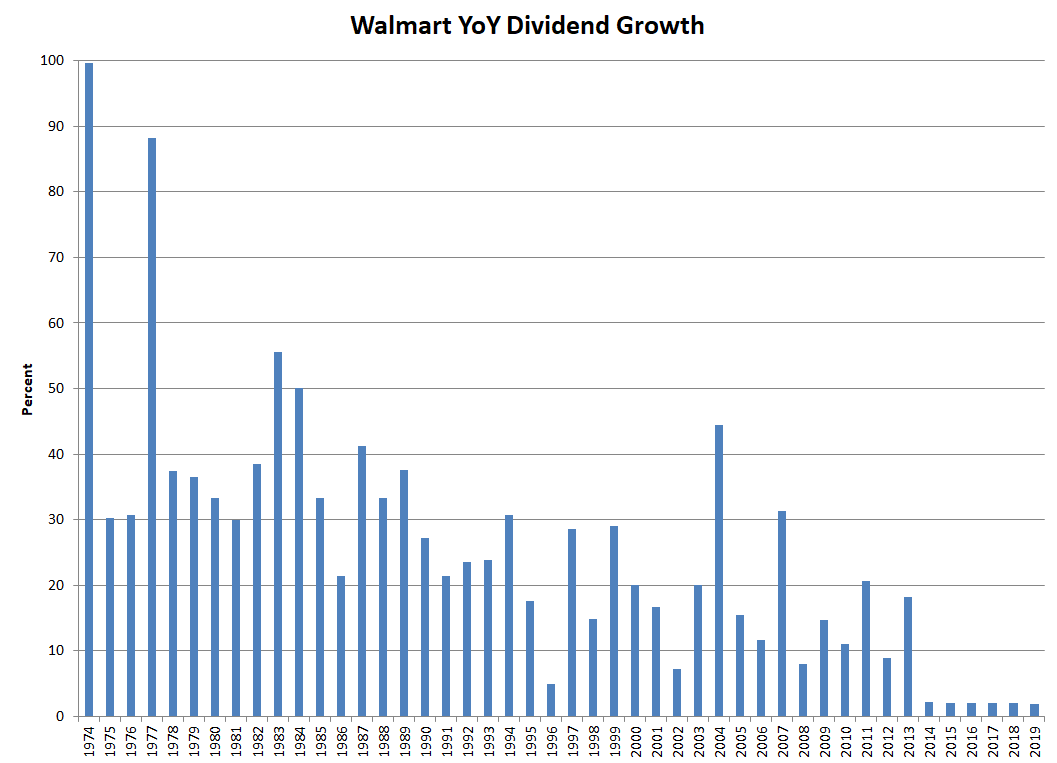
In the early years, Walmart regularly posted dividend growth of 30% or more. As the decades passed, dividend growth gradually slowed, dropping into the 20% range in the 1990s and slowing to the mid-teens in the early 2000s. Recently, dividend increases have barely kept up with inflation. (Walmart also experienced payout creep, moving from 16% in 2000 to 46% in 2017)
Another example is Johnson & Johnson (JNJ):
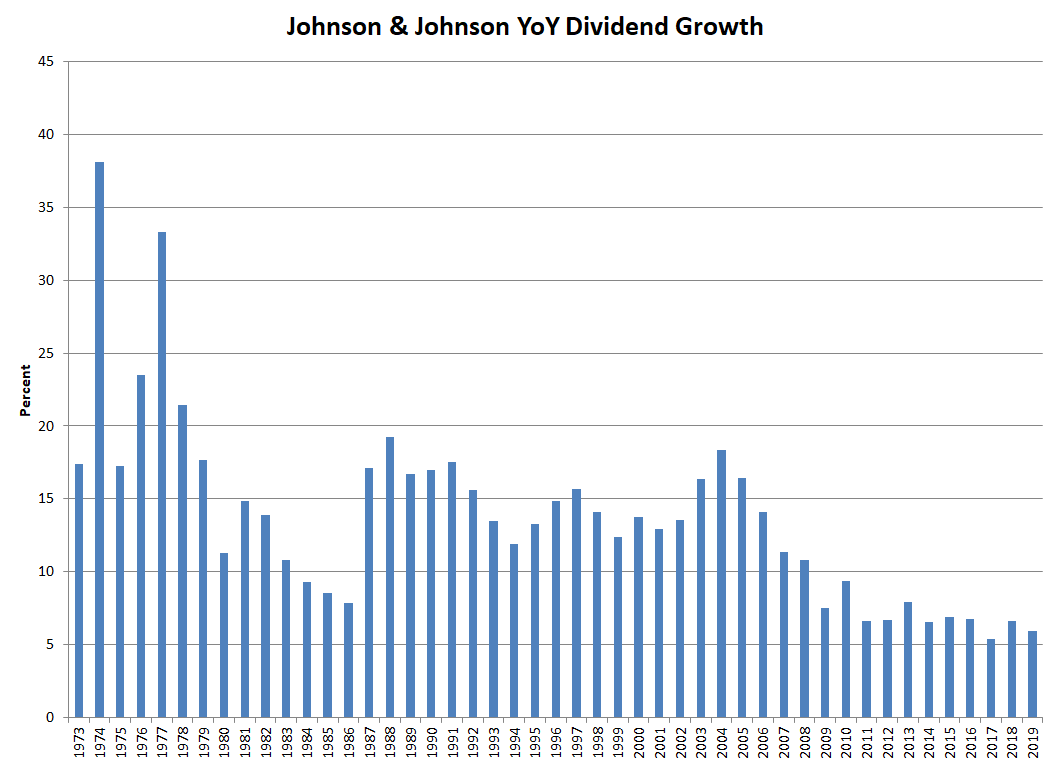
Although JNJ’s rapid dividend growth phase began tapering off in the 1980s, it was able to reignite dividend growth into the mid-teens for another two decades before eventually slowing down.
However, just because a company is not able to raise their dividend by double digit percentages every year doesn’t mean it cannot achieve high growth. It can be illuminating to look at the compound annual growth rate of the dividend over prolonged time periods. Below is a table of selected companies with 40+ year dividend growth streaks, ranked by 30 year dividend CAGR.
| Sector | 10 Yr CAGR | 20 Yr CAGR | 30 Yr CAGR | |
| LOW | Consumer Discretionary | 19.39 | 23.55 | 18.04 |
| WMT | Consumer Staples | 7.18 | 12.50 | 15.57 |
| MCD | Consumer Discretionary | 8.72 | 17.28 | 14.90 |
| SYY | Consumer Staples | 4.97 | 10.82 | 14.80 |
| ITW | Industrials | 12.62 | 13.65 | 14.42 |
| ADP | Information Technology | 10.61 | 13.16 | 14.32 |
| ADM | Consumer Staples | 9.60 | 10.96 | 13.67 |
| WBA | Consumer Staples | 13.63 | 13.97 | 12.75 |
| MO | Consumer Staples | 9.70 | 10.73 | 12.21 |
| HRL | Consumer Staples | 16.03 | 12.30 | 12.06 |
| TGT | Consumer Discretionary | 14.69 | 13.68 | 11.73 |
| JNJ | Health Care | 6.87 | 10.12 | 11.51 |
| SHW | Materials | 12.28 | 11.87 | 11.44 |
| BDX | Health Care | 8.91 | 11.68 | 11.22 |
| PEP | Consumer Staples | 7.96 | 10.30 | 11.00 |
| GWW | Industrials | 12.30 | 11.62 | 10.88 |
| KO | Consumer Staples | 6.91 | 8.38 | 10.27 |
| DOV | Industrials | 11.00 | 9.88 | 10.07 |
| NDSN | Industrials | 14.51 | 9.33 | 9.88 |
| LEG | Consumer Discretionary | 4.44 | 7.76 | 9.86 |
| CL | Consumer Staples | 7.11 | 9.18 | 9.52 |
| PH | Industrials | 13.02 | 10.60 | 9.23 |
| CLX | Consumer Staples | 7.72 | 8.71 | 9.11 |
| PG | Consumer Staples | 5.56 | 8.08 | 9.03 |
| CSL | Industrials | 11.07 | 8.69 | 9.02 |
| KMB | Consumer Staples | 6.01 | 7.37 | 8.40 |
| MDT | Health Care | 10.23 | 14.24 | 7.93 |
| SPGI | Financials | 9.74 | 8.70 | 7.65 |
| MMM | Industrials | 10.94 | 8.53 | 7.54 |
| SCL | Materials | 8.58 | 6.23 | 7.11 |
| FUL | Materials | 8.93 | 5.84 | 6.50 |
| EMR | Industrials | 4.05 | 5.57 | 6.35 |
| RPM | Materials | 5.77 | 5.59 | 6.27 |
| GPC | Consumer Discretionary | 6.58 | 5.50 | 5.99 |
| PPG | Materials | 6.40 | 4.90 | 5.76 |
| SWK | Industrials | 7.58 | 5.83 | 5.59 |
| UVV | Consumer Staples | 5.08 | 4.72 | 4.82 |
| SJW | Utilities | 6.16 | 5.65 | 4.69 |
| TNC | Industrials | 5.20 | 4.29 | 3.89 |
| FRT | Real Estate | 4.65 | 4.30 | 3.73 |
| NFG | Utilities | 2.68 | 3.21 | 3.26 |
| MSEX | Utilities | 3.20 | 2.51 | 2.71 |
We can see some interesting trends here. Consumer staples and consumer discretionary companies top the list of high-growth companies. Healthcare, materials, and industrials generally fall into the average growth category. Unsurprisingly, utilities dominate the low growth section.
Looking more closely at the numbers, we can discern two distinct patterns: one in which growth is consistent across 10-, 20-, and 30- year time frames, and a second in which the shorter time frames show decreasing growth. The first suggests companies that are still actively growing in recent years, while the latter suggests companies which had a higher growth phase in the past and are now more mature and growing at slower rates. (Of course, this does not tell us whether companies are changing their payout ratios as discussed in the previous section)
Based on this admittedly small dataset, we can conclude that it is possible for companies to sustain high growth over the span of 30-40 years. However, only a relatively small number of companies have been able to do so historically.
Economic Sensitivity
We looked at year to year growth trends for Walmart and Johnson & Johnson, but these were relatively special cases with high sustained growth in all economic conditions. What about more “normal” companies in which financial performance is more closely tied to the ebb and flow of the economy?
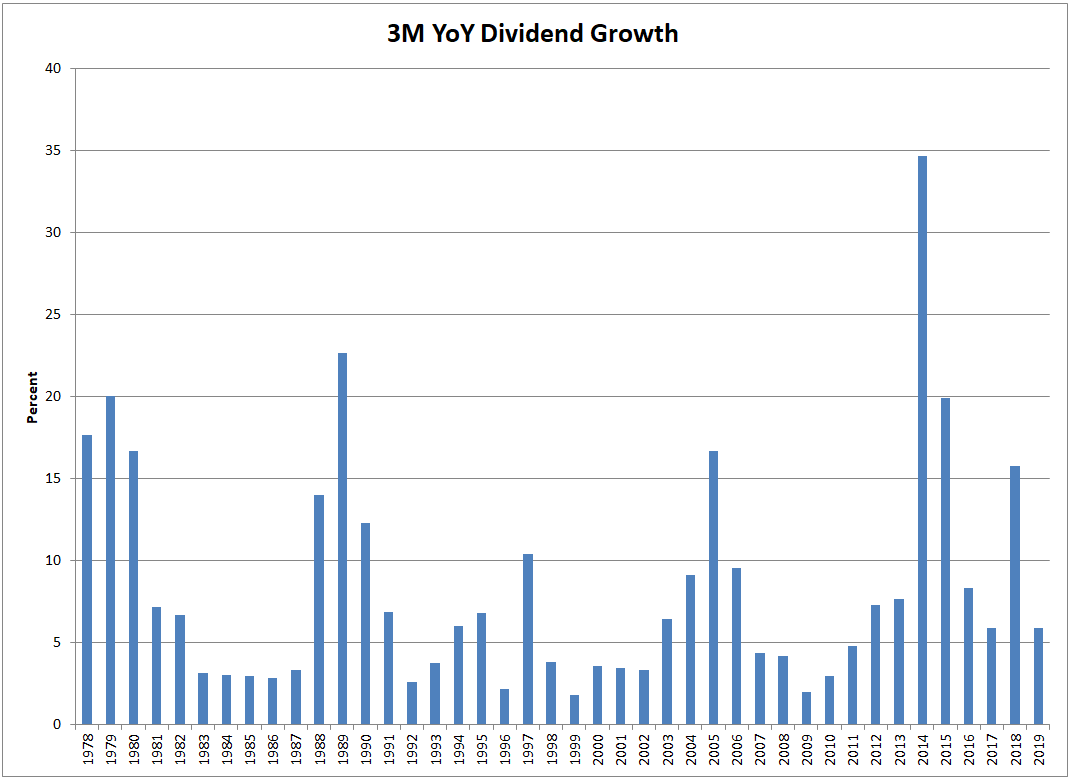
3M (MMM) is an interesting case representing how dividend growth can occur in cyclical companies. We see distinct periods of alternating high growth followed by low growth, typically coinciding with economic expansions or recessions. Over the last 42 years, this has averaged out to 8.2% CAGR.
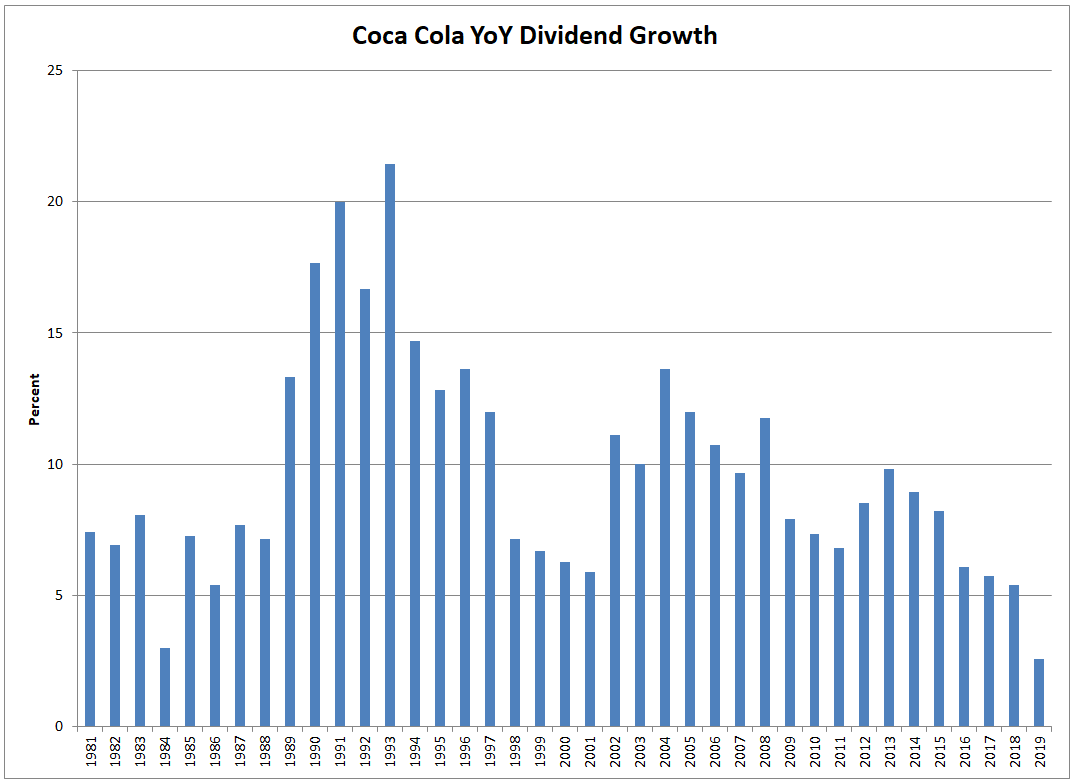
Coca cola (KO) was once a high growth company, but is now maturing, seen in the slow decline of its growth rates. Interestingly, dividend growth seemed to be deliberately restricted in years corresponding to economic recessions (1999-2001, 2009-2011).
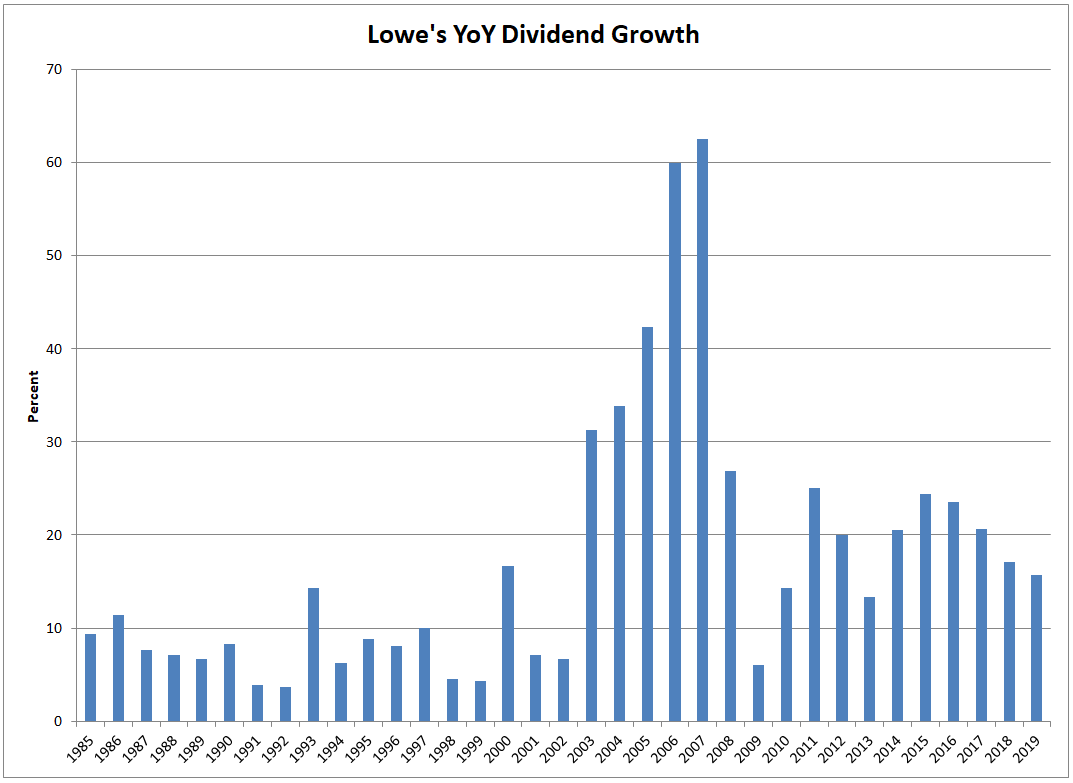
Although Lowes (LOW) tops the charts for dividend CAGR across all time periods, it actually spent several decades as an average dividend grower before suddenly posting astronomical growth from 2003-2008. Lowes’ recent dividend growth has been supported by a combination of earnings growth and an increase in the payout ratio from 7% in 2000 to 37% today. As before, we can see that management deliberately limited dividend growth during recessionary periods (2001-2002, 2009).

Utilities like National Fuel Gas (NFG) can exhibit rapid dividend growth due to expansion of customer base or rate changes, but over time, tend to grow about in line with inflation. Utilities are relatively insensitive to economic conditions, and we can see that there is steady, low growth across several economic cycles.

Federal Realty (FRT), one of the oldest real estate companies, had about a decade of high growth early in its corporate life, but eventually settled down to low/average growth rates.
Lessons Learned
Hopefully I have showed you how a company’s dividend payout policy can influence its rate of dividend growth. A decision by management to move to a higher (or lower) payout can artificially increase (or decrease) dividend growth, and this can play out over a prolonged period of years or decades. However, it is important to remember that dividends are ultimately supported by earnings and long term investors should be more interested in the underlying fundamentals of the business.
Looking at historical dividend growth rates for various companies gives us some insight as to how dividend growth can play out over a long time horizon. We’ve seen that it is possible for high quality companies to sustain double digit dividend growth rates over multiple decades. But eventually, growth does seem to revert to more “average” rates. I will also caution that such historical data has a high survival bias – for every Lowe’s or Walmart or Johnson & Johnson, there were likely dozens of other companies which ended up being bought out or having to cut or freeze dividends.
What does this mean for the high growth vs high yield debate? Principally, this debunks the idea that high growth can be sustained indefinitely. A reasonable upper limit for sustained high growth might be in the range of 20-30 years. As we saw last week, this is approximately the amount of time it takes for high growth to catch up with high yield in terms of yield on cost. This certainly complicates the picture with regards to optimal long term investment strategy. Next week, we’ll take a closer look at these implications and how dividend reinvestment might factor in.