
Dividend Kings was always envisioned as a valuable service for conservative long-term income investors during normal economic/market times.
But it was meant to be an invaluable one during times of significant uncertainty and market turmoil as we see now.
- Recent Market Action A Value Investor’s Perspective – Chuck Carnevale
- Sleeping Well As The Black Swan Sings – Nick Ward
- 3 Ways To Stay Safe And Safe In Scary Times Like These – Adam Galas
- Dividend Kings Round Table: Stay Calm, This Too Will Pass– DK podcast
- The Stock Market: A Pragmatic View– Chuck Carnevale
- Nick’s Picks: All The Trades I’ve Made Thus Far During March– Nick Ward
The above articles are just some of the examples of our work that is meant to provide the proper information/context and analysis for investors who are facing a firehose of uncertainty/scary headlines right now.
To this valuable body of work, I now add this article, explaining three essentials facts for not just surviving the current bear market, but thriving and prospering from the unpredictable but certain recovery that will surely follow.
Essential Fact 1: A Prudent Long-Term Plan That Works For Your Needs Is What Will See You Through This
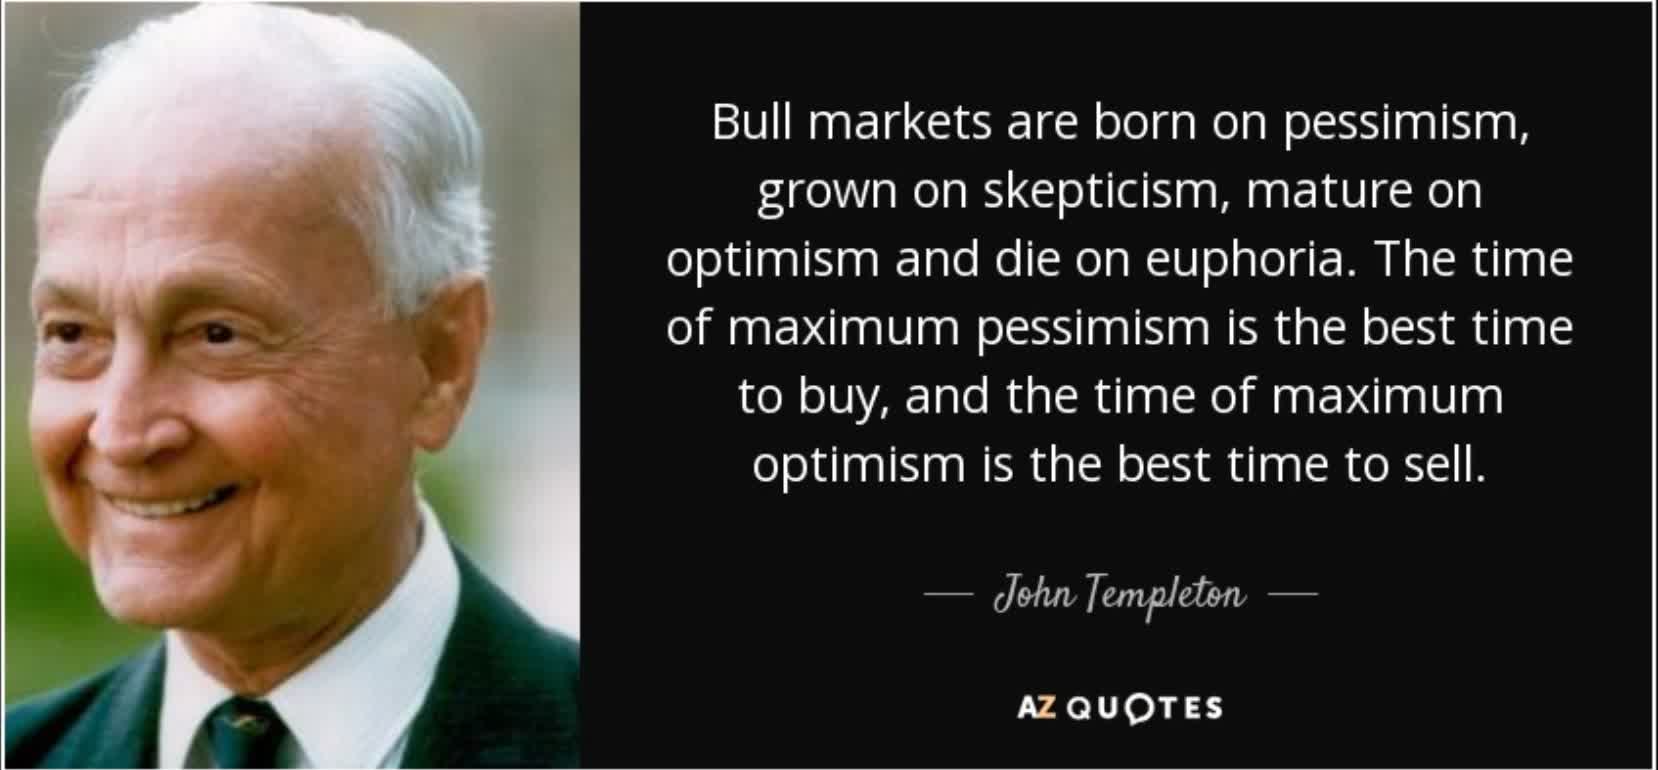
The reason for long-term investment planning isn’t just to profit from the 75% of years when stocks go up. It’s to avoid painful losses during bear markets.
Ritholtz Wealth Management is one of the best fundamental focused asset managers in the world. It’s analysts and asset managers include some of the smartest financial bloggers in the world
- Ben Carlson (A Wealth of Common Sense)
- Joshua Brown (The Reformed Broker)
- Michael Batnick (The irrelevant investor)
- Nick Maggiulli (Of Dollars and Data)
Ritholtz was founded by Barry Ritholtz, who oversees this dream team of world-class analysts, data scientists, and asset managers. Here’s his advice for investors during this correction.
Investing: It is probably too late to sell and too early to buy. Regardless, you should not let even a global health freakout panic you into doing something you will regret later, including unplanned panic selling.
It always comes down to this: Have a plan, make sure it is one you can live with, and execute it faithfully. Trying to make decisions on the fly in an emotional environment of unknown outcomes is an expensive exercise in folly.” – Barry Ritholtz
I can’t stress enough how much sticking to a plan is critical right now.
These are the days when you don’t need financial advice, you need a psychologist. This is why managing people is always more important than managing investments when you work in the financial services industry. Anyone can build a portfolio. Not everyone can stick to a plan…
My only suggestion for today is to make sure you have a plan, even if it’s a suboptimal plan. No one survives this type of volatility without a plan in place. Even a suboptimal plan is better than nothing because at least it gives you some rules and guidelines to follow. ” – Ben Carlson (emphasis added)
While it might be tempting to just sell everything and wait for the market to bottom, or at the very least to not buy anything until the “dust settles” it’s important to remember that this is impossible to do.
Why don’t we just sell everything and wait this out? Get back in when the dust settles?”
This is the question every financial advisor is getting this week, from at least one or two clients. They’re asking out of genuine curiosity, not just panic or fear. And it’s a great question.
The great answer is that you won’t know when the dust settles. There’s no airplane writing the “all clear” in the sky above your neighborhood. And when the dust settles, do you think stocks will be at their lows? Or will they have already rallied furiously, in anticipation of this? Let me give you an example.
Today is March 9th. Precisely eleven years ago today, in 2009, the stock market stopped going down. There was no reason. The dust had settled, without fanfare or any sort of official announcement. If you had polled people that day, or week or even month, most would not have agreed that we had seen the worst.
The economic headlines were not improving. But there it was. And by June 1st, less than 3 months later, the stock market had climbed 41% from that March low. And even with that having happened, the majority of participants still weren’t clear that the dust had fully settled. That we had, in fact, seen the worst.” – Joshua Brown, CEO Ritholtz Wealth Managment (emphasis added)
How do you build a properly diversified and properly risk-managed portfolio for your specific needs?
- 3 Critical Things You Need To Know About Your Risk Profile
- A Step By Step Guide To A Sleep Well At Night (NYSEARCA:SWAN) Retirement Portfolio
Why am I, and some of the world’s best financial advisors, so emphatically emphasizing trusting your long-term plan right now?
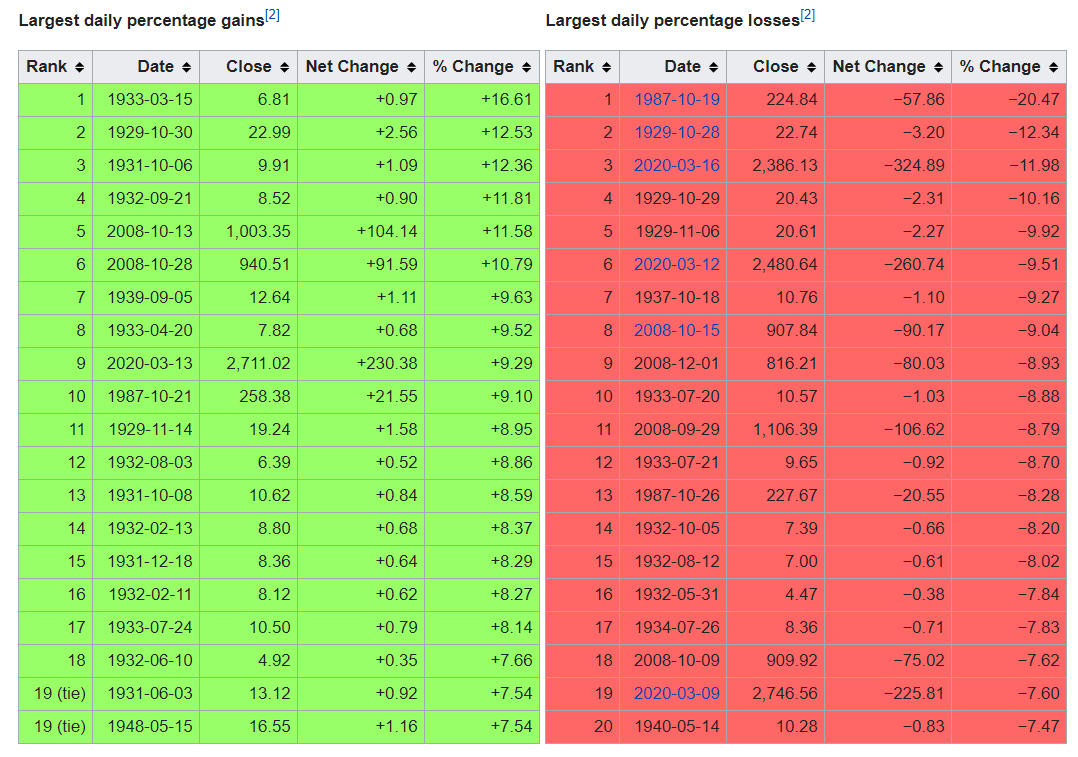
(Source: Wikipedia)
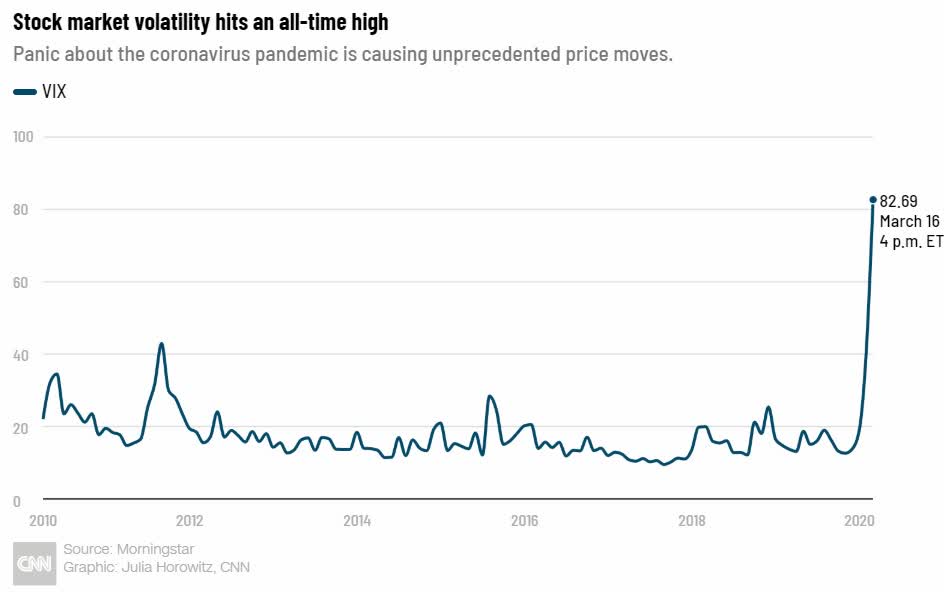
Because when the stock market has seen three of its worst 20 days in history in just the past few weeks, it’s easy to give in to panic and make potentially disastrous mistakes.
The VIX is the market’s volatility index, and is often referred to as the “fear index”. On Monday, March 16th, the S&P 500 closed down 12%, the 3rd worst day in history.
The VIX closed at its highest level ever, surpassing even the 80.9 seen during the Financial Crisis.
It’s actually not the highest volatility in history, which occurred in 1987 when the stock market fell 20.5% in a single day.
While the VIX — or the stock market’s “fear gauge” — wasn’t officially launched until 1993, reverse engineering by the Chicago Board Options Exchange (CBOE) shows us just how panicked the stock market was on Black Monday. The CBOE S&P 100 Volatility Index (VXO), which basically uses the pre-2003 VIX volatility calculations and has price history going back to 1986, rose 313% to an all-time closing high of 150.19.” – Schaeffer Investment Research (Emphasis added)
However, as I write this the S&P 500 futures are “limit down” meaning they hit -5% and became locked at -3.7%.
In fact, the S&P 500 has swung 4% or more in either direction for the last seven consecutive sessions, topping the previous record of six days from November 1929.” – Seeking Alpha
In several ways, we are facing an unprecedented amount of fear in the market. Some of that is justified, as I’ll discuss in section three. However, most of it is based on the uncertainty we face surround economic and corporate earnings growth this year.
In a vacuum of hard data, numerous hyperbolic claims are being made, both in the mainstream media and on social media.
For God’s sake, stop getting your Coronavirus news from Facebook — its Darwin’s latest development in natural selection.” – Barry Ritholtz (emphasis added)
Now I know that some of you are not content merely with calls from top analysts for calm, and I totally understand why.
While I disagree with nearly everything Lenin believed in, this quote is apt and describes how many of us feeling right now. The market is reacting to a firehose of information with wild swings that include even the highest quality blue chips crashing up to 25% in a single day (as Realty Income and Lowe’s did on March 16th).
So here is essential fact #2 that you need to know, about why sticking to your long-term plan will almost certainly be worth it.
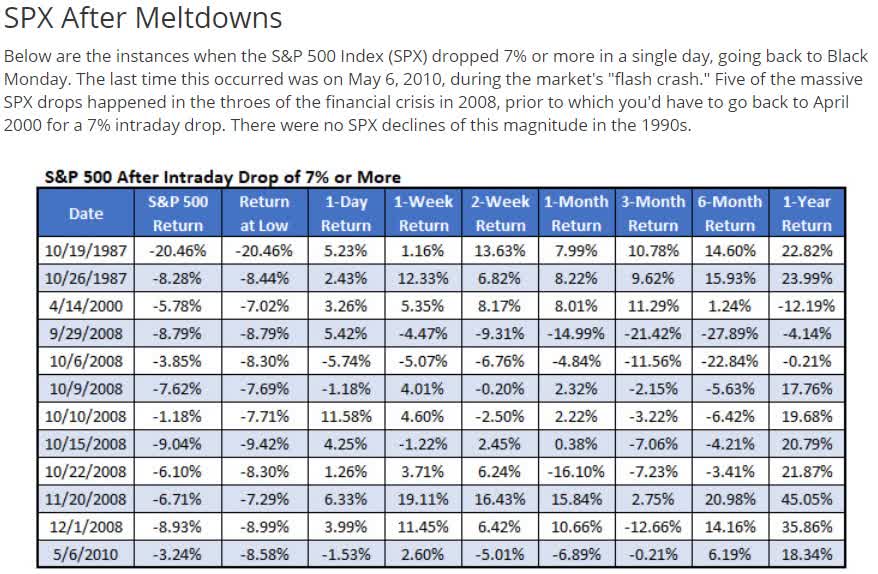
Essential Fact 2: The Patience To Ride Out Market Storms Like This Means You Profit From The Incredible Rallies That Inevitably Follow
(Source: Shaeffer Investment Research)
Days like Monday, March 16th were shocking to all people, even investment veterans. However, as you can see, the forward returns following epic market single day crashes are usually followed by strong gains over the next year.
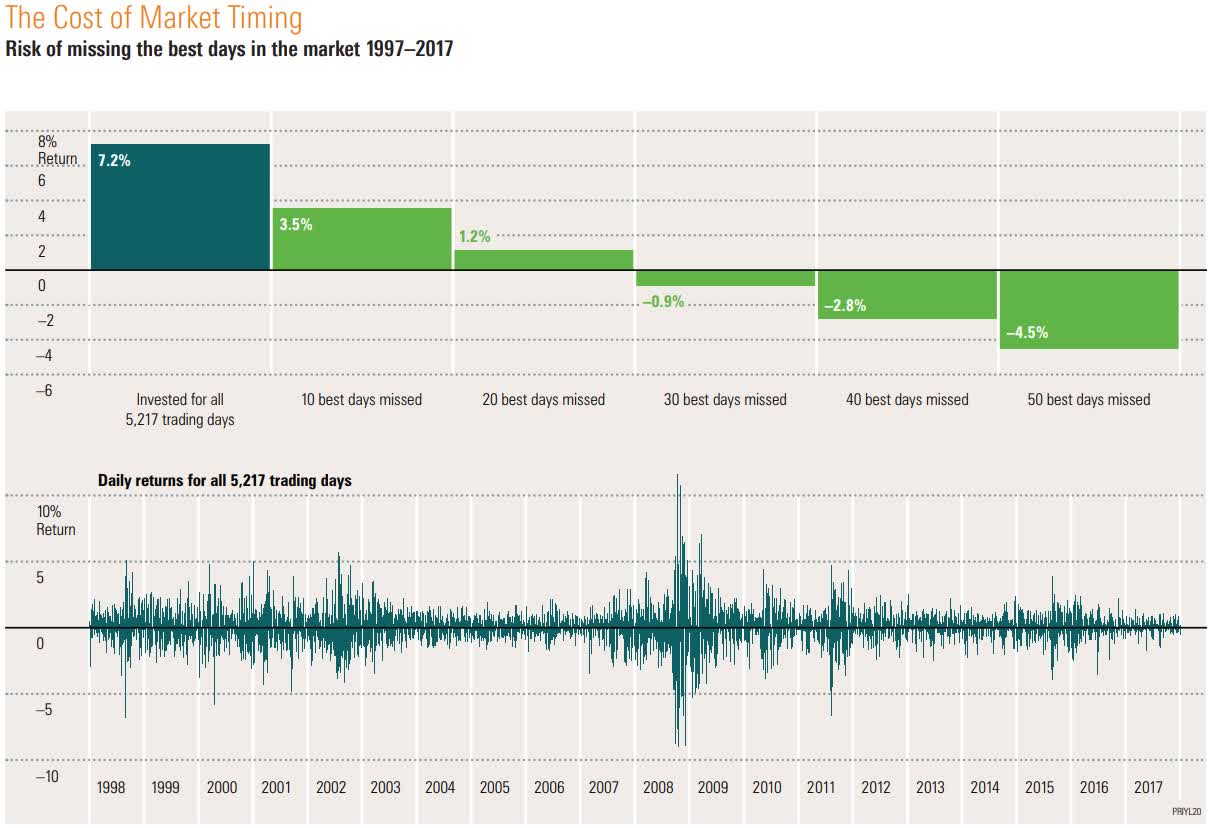
This note was published by Bank of America on March 7th, explaining just why market timing and panic selling is a bad plan, to be avoided at all costs.
Looking at data going back to 1930, Bank of America found that if an investor missed the S&P 500′s 10 best days in each decade, total returns would be just 91%, significantly below the 14,962% return for investors who held steady through the downturns.
The firm noted this eye-popping stat while urging investors to “avoid panic selling,” pointing out that the “best days generally follow the worst days for stocks.” -CNBC
99.4% of the market’s total returns over the past 90 years have come from just 270 of its best single days. The same days that cluster around periods of panic like we’re seeing now.
Missing the market’s best days, 80% of which come within two weeks of the worst, is how you can turn 300% 20-year total returns into a 60% portfolio decline.
The more short-term pain we feel today, the better our long-term returns will be.
The Bigger The Decline The Higher The Future Returns

(Source: Michael Batnick)
Here are the historical market returns following declines since 1950. After 1 year they are annualized.
Once stocks fall 20%, long-term returns start to improve with every painful leg lower. This is why it’s so important to stay in the game. Nobody ever said you have to have all of your money in stocks, but you can’t be all cash either because lower returns today plant the seeds for higher returns tomorrow.” – Michael Batnick (emphasis added)
How bad could this bear market get? No one knows but here are some educated guesstimates.
Goldman Sachs has updated its bear market model for the following ranges.
- base case -5% EPS growth this year
- base case: 2450 S&P 500 bottom by mid-year (-27% bear market peak decline)
- median worst-case decline: -41% (S&P 500 2000)
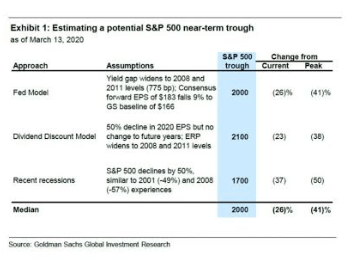
- 3,200 S&P 500 by end of the year (V-shaped recovery, 31% to 60% rally in the second half of the year)
While it’s true that no model is ever to be taken as gospel, it’s important to realize that there is a strong consensus right now that after the market bottoms the recovery from the temporary but severe economic/corporate earnings shock we’re facing, is likely to be strong.
I can’t tell you whether or not Goldman’s 3200 S&P 500 forecast for the end of the year will prove true.
Here’s Ritholtz Wealth Management’s Michael Batnick with his educated guess about what happens next and more importantly what his plan is for this bear market.
As far as the markets go, I don’t think the S&P 500 low of 2367.04 is going to hold. I’d put the odds of new lows at 60%. My best guess is we get a ~10% rally and roll over, ultimately falling 40% from peak-to-trough. I don’t believe this with very much conviction, let’s go with 10%, and I do not plan on acting on my intuition…
So here is what I plan on doing.
I will continue to make regular automatic contributions into my 401(NYSE:K) and into my taxable account. Both are fully invested in the stock market. If stocks fall 40% from their peak, so another 18% from here, then I plan on taking money out of my emergency reserve and moving it into the market. If they fall 50%, or another 17% from where I bought, then I will buy more. If they keep falling, then I’ll have bigger things to worry about than my portfolio.
I encourage you to write down your thoughts and put together some sort of plan if you haven’t already.
If you’re on the brink right now, imagine how you’ll feel if stocks fall another 20%. I hope we never get there, but investors have to be prepared for anything at this point, because right now, nothing feels obvious, and hindsight is 2020.” – Michael Batnick
This is the same advice that all the Dividend Kings have been giving. Stay calm, keep buying steadily if you can, and above all else, don’t panic sell if the fundamentals of your companies remain intact. H
opefully, you had a plan in place before this began, and are sticking to it.
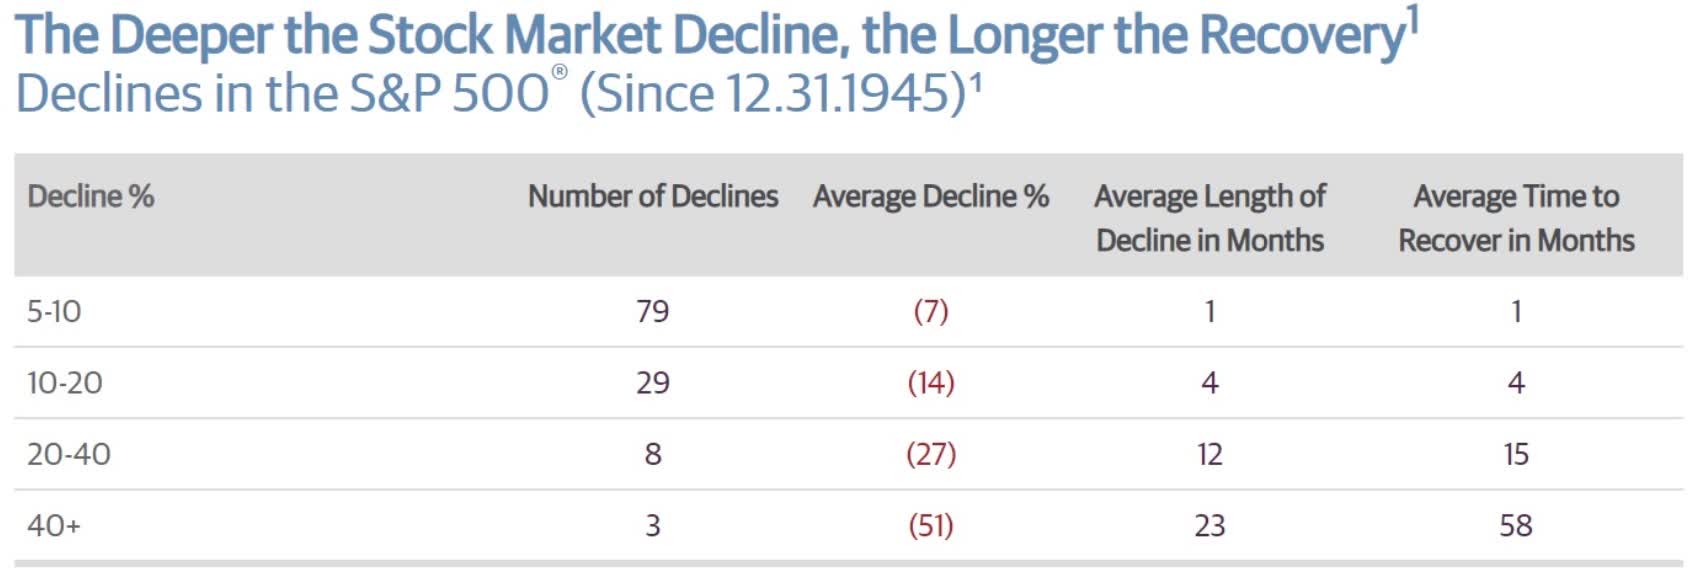
Here is what I can tell. Since 1928, which includes the Great Depression, the average it’s taken stocks to hit record highs after a bear market bottom was 26 months.
(Source: Guggenheim Partners, Ned Davis Research)
Since 1945 the average recovery period for bear markets is 15 months. Given the current economic forecasts, we’re seeing, which are based on the pandemic ending this year, it’s indeed possible, or even likely, that the market will see new record highs next year.
I understand if that might seem implausible or even outlandishly bullish in these dark market times. But here is the evidence to back that up.
Essential Fact 3: A Business-Like Thought Process Focused On Facts, Not Fear Or Panic, Is How You Can Best Make Reasonable Long-Term Decisions
First, let’s address the two major concerns the market has right now.
Here is a brief update about the Coronavirus pandemic.
This week, there will be 1.9 million coronavirus tests shipped out to hospitals, government agencies and public health professionals all over America. The one thing we know for sure is that a lot of people will test positive for COVID-19.” – Joshua Brown
The US is about two weeks behind mass testing for the virus, which means our daily new cases will likely take longer to peak than other countries.
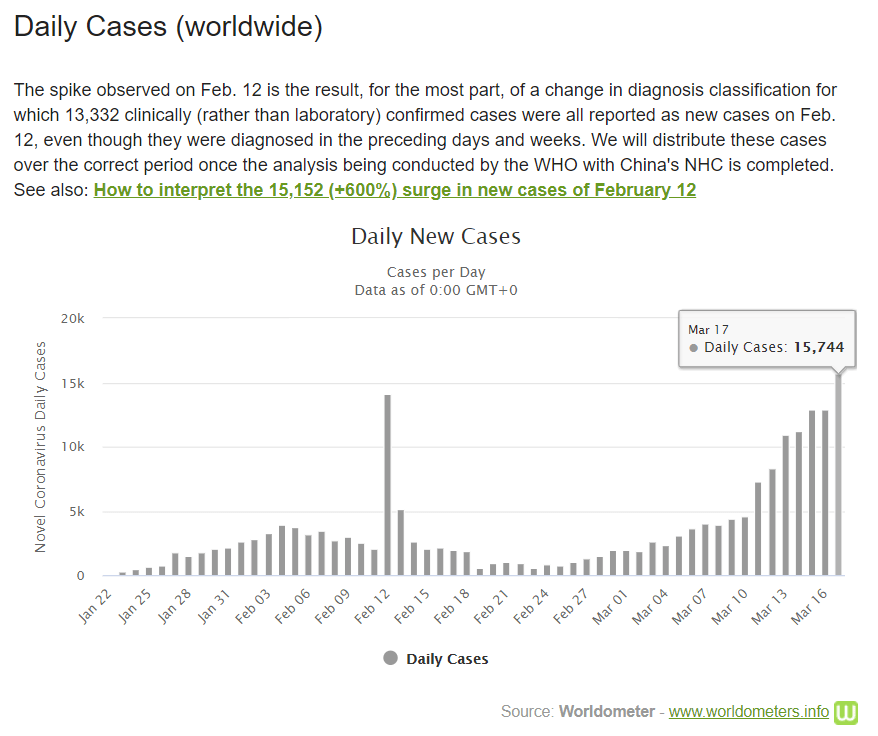
The new global cases being reported continue to rise, but that’s not surprising given that strong containment efforts have been going into effect after March 9th (when Italy locked down its economy).
Conservative COVID-19 Final Case Forecast
| Country | Population | Cases | Population/Cases | Projected Final Cases |
| China | 1386000000 | 80894 | 17134 | NA |
| US | 327200000 | 6524 | 50153 | 170449 |
| Italy | 60480000 | 31506 | 1920 | NA |
| Iran | 81160000 | 16169 | 5019 | 42279 |
| South Korea | 51470000 | 8320 | 6186 | 26812 |
| Spain | 11826 | 9942 | 1 | 6 |
| France | 66990000 | 7730 | 8666 | 34897 |
| Germany | 82790000 | 9367 | 8838 | 43128 |
| Switzerland | 8570000 | 2742 | 3125 | 4464 |
| Japan | 126800000 | 882 | 143764 | 66054 |
| Norway | 5368000 | 1701 | 3156 | 2796 |
| Netherlands | 17180000 | 1705 | 10076 | 8950 |
| UK | 66440000 | 1950 | 34072 | 34611 |
| Sweden | 10120000 | 1196 | 8462 | 5272 |
| Denmark | 5603000 | 977 | 5735 | 2919 |
| Belgium | 11400000 | 1243 | 9171 | 5939 |
| Austria | 8822000 | 1332 | 6623 | 4596 |
| World | 7,771,000,000 | 198770 | 39095 | 4048167 |
(Sources: Johns Hopkins, CDC, WHO, World Of Meters, US Census Bureau, IMF).
If every country ends up with the same case rate as Italy, the hardest-hit nation so far, then we could end up with over 4 million confirmed cases by the time this pandemic ends.
- bullish forecast: 453K
- conservative forecast: 4 million (and rising daily until Italy contains the virus)
- current global cases: 198,770
My point in showing you this data is to make it very clear that this pandemic is not likely to end soon. I believe in making long-term decisions based on the best available data we have.
In the short-term, it’s just as important to be realistic and pragmatic, so that short-term bullishness doesn’t get smashed and turns into despair and or panic.
The good news is the widespread testing that’s coming to the US soon and has been in place in most countries for a few weeks now, is a proven method of fighting the pandemic.
South Korea has been the developed nation with the most aggressive testing regimen to date.
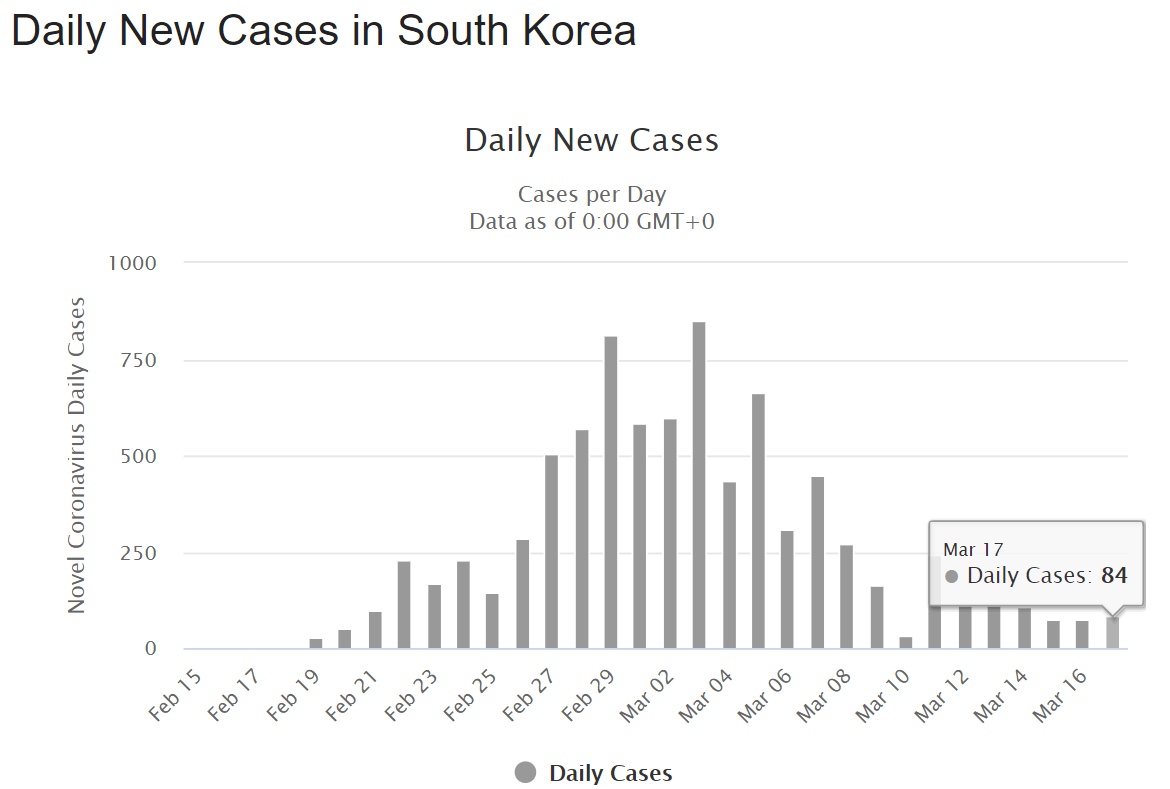
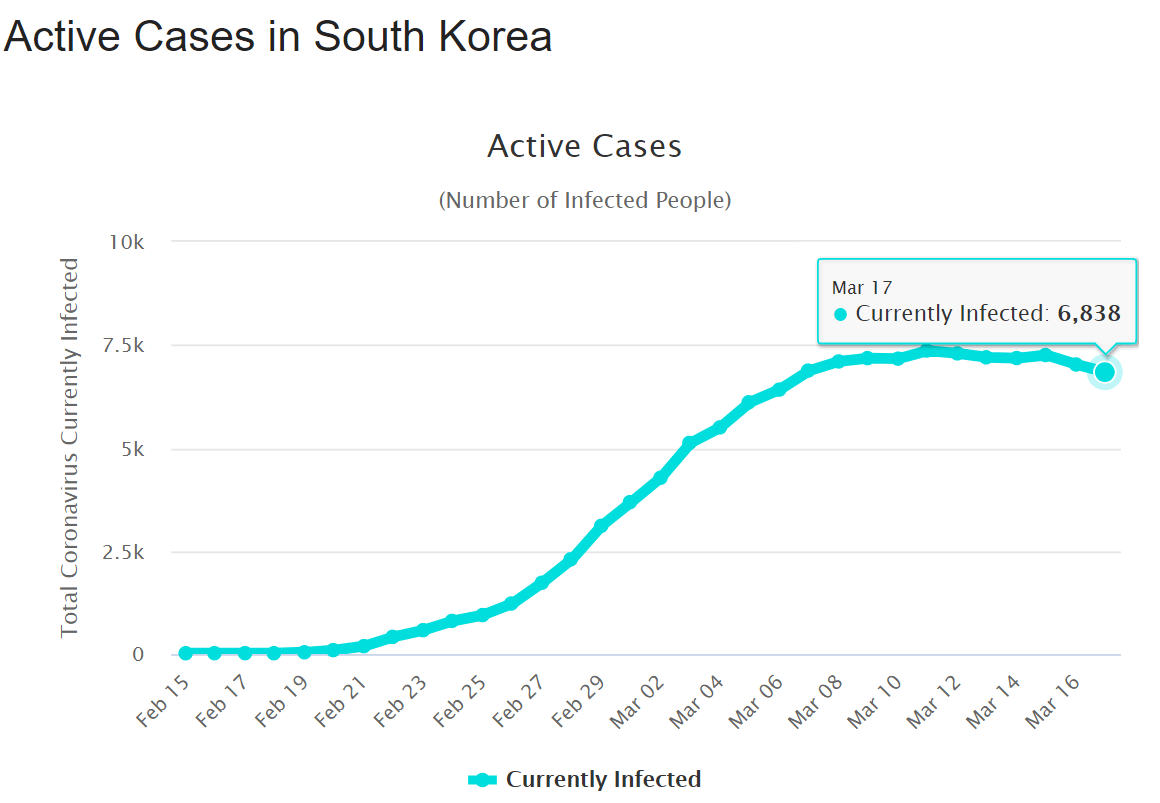
(Source: World of Meters)
Notice the time frame of South Korea’s cases. Over about two weeks the new daily cases rose exponentially. Containment/testing has started having an effect over the past month, with the number of active cases now peaking and beginning a gradual decline.
China is another good case to see how effective locking down an economy is at stopping this virus.
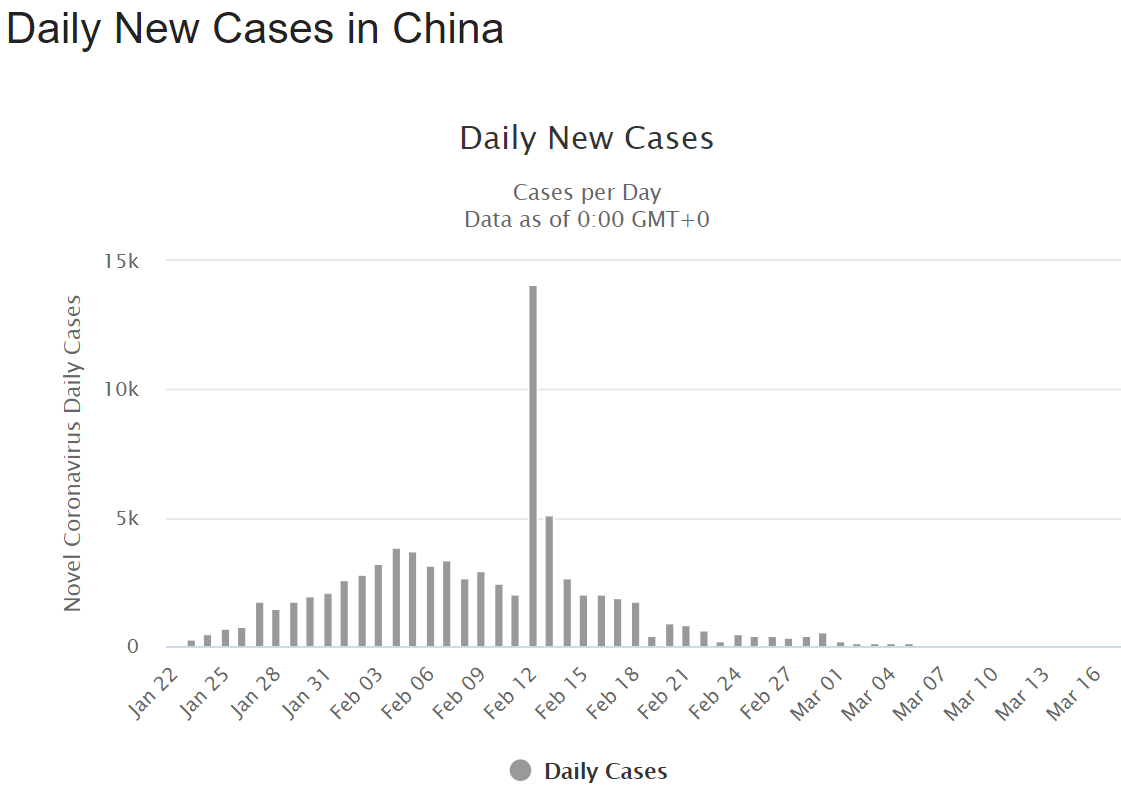
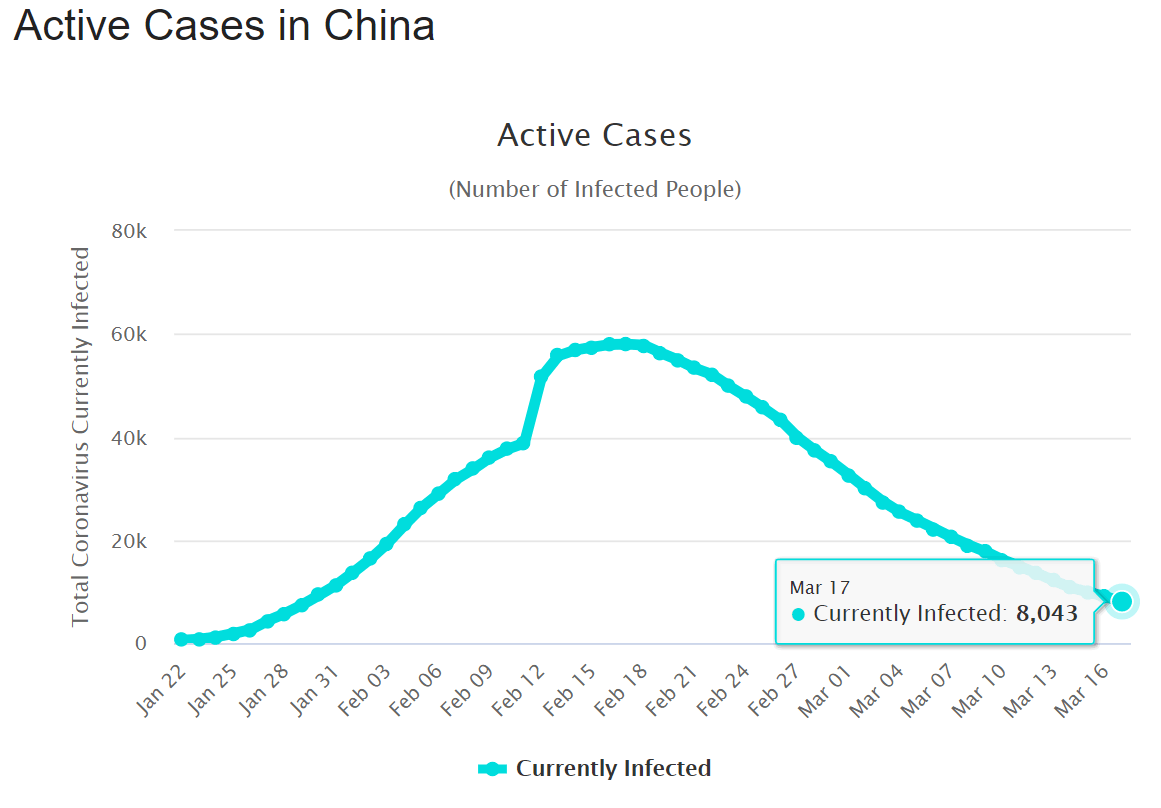
(Source: World of Meters)
Italy, France, Spain, have all instituted lockdowns. Several US states/cities are following similar measures.
While I know that waiting a few weeks might seem like an eternity right now, the fact is that in the coming weeks we will likely start to see a peak in new cases in hard-hit countries.
Now let’s move onto the economic effects, which are going to be severe but hopefully short.
On March 13th, Bank of America Global Research put out a note that indicated its latest economic forecasts.
The economy will flirt with a recession in the coming months with negative GDP in 2Q, we believe…Growth is expected to remain soft in 3Q with recovery starting thereafter. Get ready for disinflation – headline slowing notably and core remaining below target. An aggressive policy response is needed.”
The firm cut its growth forecast for the second quarter to negative 0.5% from 1%, The economists now expect a return to very sluggish growth of just 0.3% for Q3 GDP and a rebound to 1.8% in the fourth quarter. BofA now expects 2020 growth of 1.2% and 1.5% next year.” – CNBC (emphasis added)
Of course, this is just one bank’s economic model, which shows a mild negative growth quarter and a fast but hardly very strong rebound by Q4.
JPMorgan is less optimistic.
The US economy could shrink by 2% in the first quarter and 3% in the second, JPMorgan projected, while the eurozone economy could contract by 1.8% and 3.3% in the same periods.” – Market Insider
COVID-19 is expected to roll through the global economy over February, March, and April, generating GDP contractions in most countries for at least one of the two quarters it straddles,” Bruce Kasman, JPMorgan’s chief economist, said in a note. “If our current forecast is realized it seems appropriate to characterize it as a novel-global recession…
Our forecast for a mid-year growth rebound would not fit the NBER criteria that recessions should last for more than a few months.
JPMorgan expects a fading of the coronavirus outbreak to promote a recovery in activity into midyear 2020, followed by an acceleration in growth in the second half of the year. ” Kasman said. ” – CNBC (emphasis added)
Here’s Morgan Stanley’s latest forecast, which is rather pessimistic but their economists’ views based on the best available current data.
China is projected to bear the brunt of the economic contraction in the first quarter before the rest of the world absorbs the second-quarter hit, Morgan Stanley said. The economists expect the country’s economy to shrink by 5% in the first quarter before rebounding to expansion through 2020, while the US economy could contract by 4% in the second quarter.
The eurozone will face the biggest drop, with full-year growth slipping to -5%, the economists added.”
Note, however, that after a significant economic contraction in Q1, Morgan’s economists expect China will still end up posting a positive growth rate this year, due to a rapid recovery created by fiscal and monetary stimulus (the same thing coming to the US and all major developed nations).
Goldman expects the economy to bounce back sharply through the end of the year, while JPMorgan analysts said they were watching policy responses to see whether the downturn turns into a “traditional and longer-lasting recession event.”- Business Insider (Emphasis added)
What are the fiscal responses that JPMorgan is watching for?
- $1+ trillion stimulus bill proposed
- Second coronavirus relief bill could be passed this week
- Federal Reserve has cut rates to zero, begun $700+ billion QE program
- Fed has also reopened the overnight credit window, acting as a lender of last resort for 1-3 month loans to corporations
- Fed has pledged $5 trillion in total over the next month to keep the overnight lending (repo) market stable
Bloomberg contributor El-Erian, (former CEO and CIO of PIMCO) has called these efforts to mitigate and reverse the negative economic effects of the virus promising saying
The United States made encouraging progress on Tuesday in responding to the coronavirus, led by the public sector and involving supportive changes in private sector behavior…
The efforts won’t prevent the global economy from falling into a sharp recession, but they will help many Americans better navigate this extremely difficult phase of the crisis.
This whole-of-government approach is not limited to the executive branch and its work with the Fed. There were also other signs of better collaboration with Congress, including on a sweeping fiscal package that is said to be benefiting from a level of bipartisan cooperation not seen on Capitol Hill for several years.
He’s also encouraged by the fact that companies are “demonstrating a stronger spirit of cooperation, especially in the health-care, pharmaceutical, banking, and technology sectors,” including openness, collaboration, and embracing open-source research.” – Seeking Alpha
Could the economic effects be brutal in the short-term? Indeed they likely will be, at least relative to the kind of growth seen over the last decade.
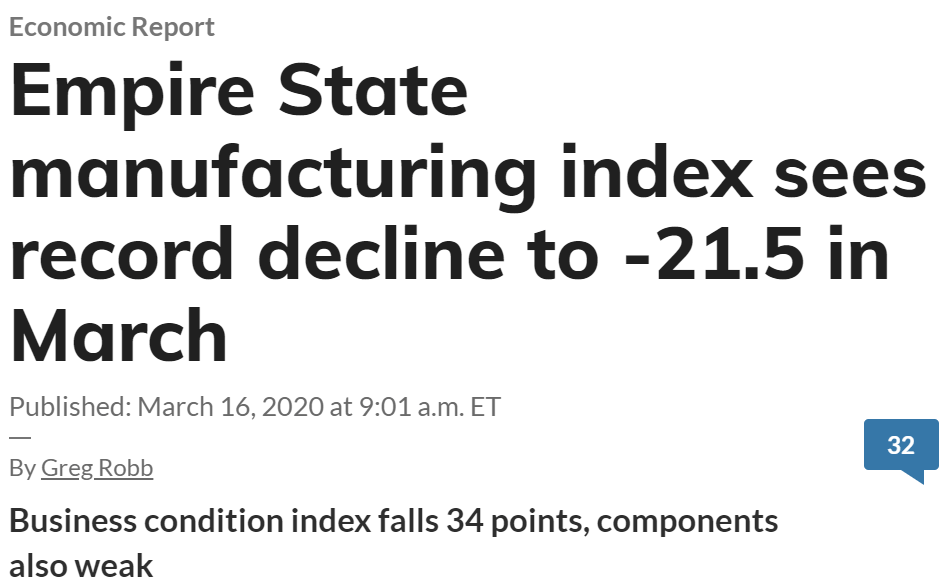
(Source: MarketWatch)
The first effects of the pandemic are starting to show up in economic data.
How bad might things get? Here’s the most pessimistic forecast I’ve yet seen, from UCLA’s Anderson School of Management.
UCLA issued the revision after incorporating more recent economic data and reviewing the economic effects of the 1957-1958 H2N2 epidemic, according to a press release. After starting the year strong, “escalating impacts of the coronavirus pandemic” have dragged first-quarter gross domestic product growth to 0.4% and second-quarter expansion to -6.5%, the Anderson School of Management said.
Third-quarter growth will slip to -1.9%, and fourth-quarter growth will reach 4% with “the resumption of normal activity,” the economists added.” – Market Insider
Note how UCLA expects a 6.5% GDP decline in Q2, but then a 4.6% improvement in Q3 and very strong 4% growth in Q4.
This echoes the sentiment of the overall consensus among the 16 most accurate economists tracked by Market Watch.

(Source: Market Watch)
The current blue chip economist consensus, which includes JPMorgan’s estimates, is for -2.0% GDP growth in Q2. Then a 2.7% recovery in Q3 and ongoing recovery in Q4 are expected, resulting in slightly positive growth for this year.
Note that next year growth is expected to return to the 2009 to 2019 average rate of 2.3%.
I can’t stress enough what all the Dividend Kings, including Chuck Carnevale, have said about this likely being a SHORT-TERM shock to global and US growth.
Do we need to be prepared for some very frightening economic data in the coming weeks and months? Absolutely.
Here’s Ritholtz Wealth Management’s CEO, Joshua Brown, providing the proper historical context in today’s highly uncertain times.
I am going to share with you something I said to the clients of our firm last week. I think it’s the most profound thing I have ever learned about crisis in the investment markets.
That something is this:
Without a doubt, the news will get worse from here. But its ability to shock us will diminish.
The economic news about the US economy was not getting better at the end of the financial crisis. But stocks stopped going down every time that bad news hit. It took a lot of pain to get to that point, but eventually, bad news fatigue had set in. This happened with regard to potential terror threats in the wake of 2001. It happened during the Asian currency crisis of 1998. It happened during the Latin American defaults of the same era. It happened during the Ebola scare of 2014. It will happen now.
You must be fully prepared for both foreboding news about the contagion’s spread and, yes, even the death rate. You must also be prepared for how bad the March economic numbers are going to be relative to February. Some of these comps are going to be so astounding that they’ll look like typos. And it’s highly doubtful that anything turns sharply higher in April, based on the fact that nearly everything under the sun has been or will be canceled other than walking the dog and surfing the web. Kroger, Costco, Amazon, Target, CVS, Walgreens, Walmart and maybe Home Depot excepted – the nesting business is booming.
But as bad as the news will be, its ability to shock us will diminish. We will reach the point of “Let me guess, sales are down this month.” The shocks – and there are many shocks still to come – will continue. But our reaction to them cannot remain at the current intensity forever. We are not going to have a 75 Vix for six straight months.
If we know one thing for sure, it is this.” – Joshua Brown (emphasis added)
This brings me to company-specific fundamentals which understandably have a lot of investors very nervous right now.
I update all 26 correction watchlist companies each Monday, with the latest consensus forecasts, updating their valuations and long-term growth consensus estimates and total return potentials. I include these updates in our weekly “companies we’re buying now” articles.
When necessary I downgrade quality/safety scores and add “speculative” classifications for temporarily higher risk companies during this pandemic.
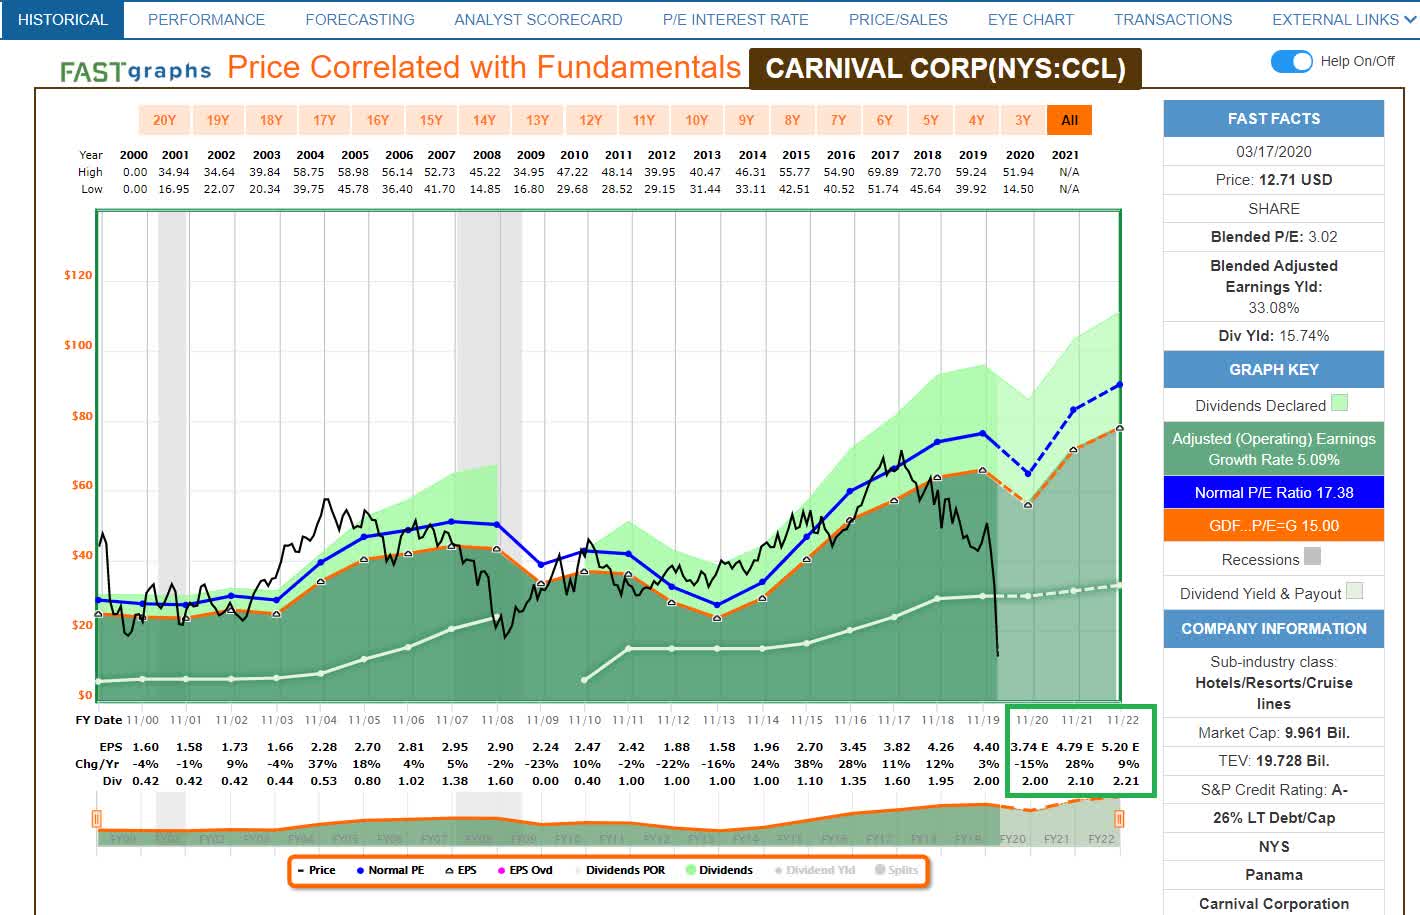
Currently, the most concerning company is Carnival (CCL).
(Source: F.A.S.T Graphs, FactSet Research)
CCL is down a shocking 75% year to date, due to being one of the most directly impacted companies. At the start of the year +4% EPS growth was expected, and that’s now down to -15%.
However, while CCL’s short-term stress has earned it a downgrade to 7/11-speculative (2.5% risk cap recommendation, a “hold” if you own more than that) I want to emphasize some important things.
- 20 analysts who cover CCL and collectively know it better than anyone but management itself, agree that this is a SHORT-TERM impact.
- 2021 EPS growth consensus +28%
- 2022 EPS growth consensus: +9%
- the long-term consensus growth rate: 8.7% CAGR unchanged since before the pandemic
It’s possible that if things get bad enough CCL might even have to temporarily cut the dividend or suspend it (analysts currently don’t expect that).
The company is making additional spending cuts and drawing down its lines of credit right now, to see it through this temporary crisis.
However, even if CCL were to get a downgrade to 6/11 and 2/5 safety (if EPS consensus growth hits -20%) that wouldn’t make it a “sell” as long as the long-term thesis remains intact. It would merely become a “hold”.
I point out CCL because many investors who bought it recently (myself included) might be nervous that the market is “pricing it as if it’s going bankrupt.”
While the risk of that worst-case scenario is never zero, analysts and S&P don’t expect a permanent loss of capital for anyone who holds on until the company recovers, as expected, after the pandemic passes.
CCL is an “A-” rated company with $11 billion in liquidity that it’s tapping right now. The stock’s collapse in recent weeks is not supported by the fundamentals, which indicate that the company will eventually return to its historical 16 to 17 PE.
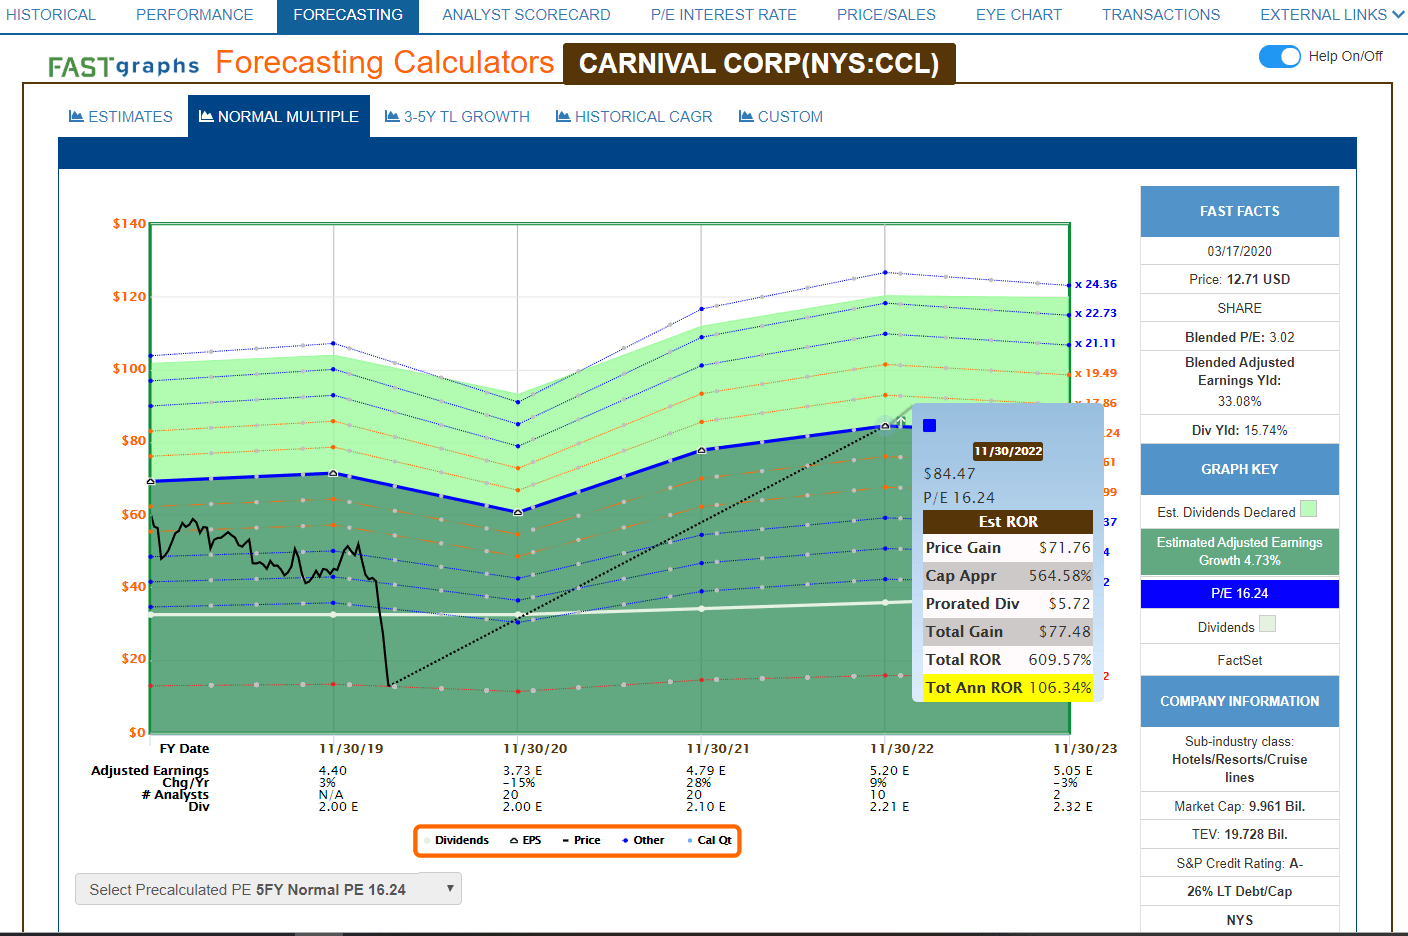
(Source: F.A.S.T Graphs, FactSet Research)
CCL at a PE of 3 is priced for about -11% CAGR long-term growth according to the Graham/Dodd fair value formula.
Analysts actually expect 4.7% CAGR growth through 2023 and 8.7% CAGR over the long-term. Might CCL fair to achieve it’s expected growth? Sure. But the point is that even 5% long-term growth over the last 20 years has seen Wall Street pay 16 to 17 times earnings.
If CCL grows as expected through 2022, long after the pandemic’s effects are likely to be gone completely, then this stock would be fairly valued at about $85.
As Chuck Carnevale explains in this article, during the short-term the market can become not just irrational about a company’s price, but downright crazy, as we’re seeing with CCL right now.
When the market freaks out over a company, whose long-term fundamental outlook is unchanged Chuck calls them “temporarily illiquid”.
Only if long-term fundamentals become impaired is a strong price decline justified. In the case of CCL, the recent crash is objectively irrational, given the best available data we have today.
Rest assured I’m watching CCL and all of the correction watchlist stocks closely each week, to make sure that my “facts and reasoning” remain right.
As long as a company’s earnings, cash flow, and dividends grow as expected over the long-term, a return to fair value is eventually inevitable.
EPD and CCL Long-Term Growth Outlooks Unchanged Since The Pandemic Began
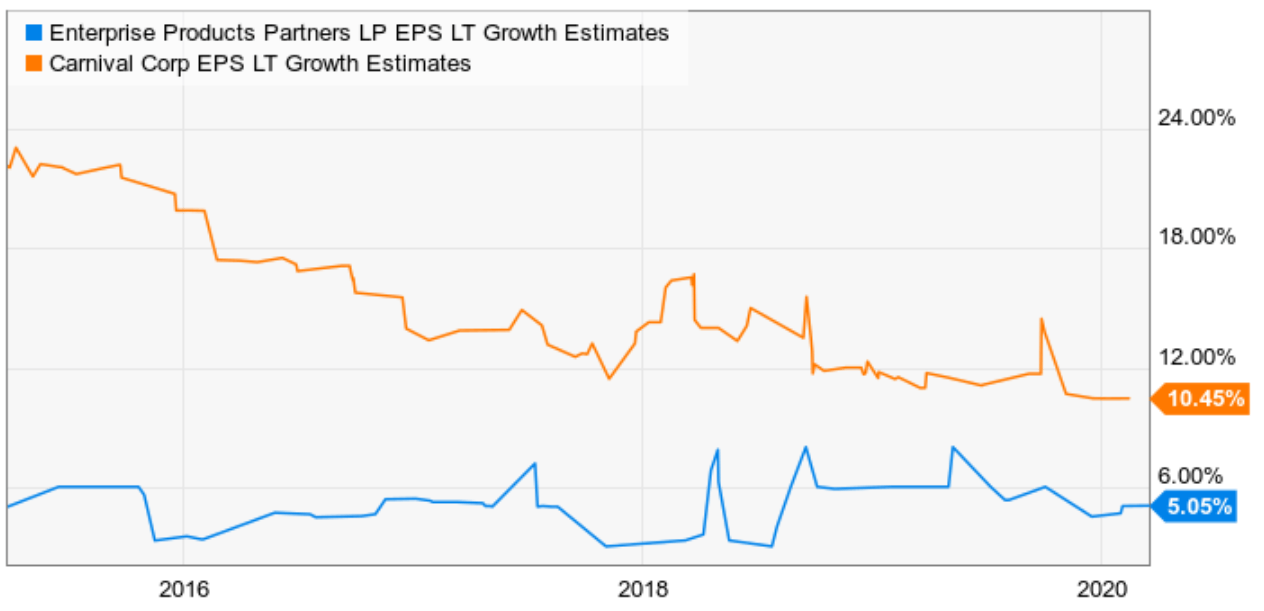
(Source: Ycharts)
Enterprise Products Partners (EPD), is another good example of a company many members own (myself included) are worried about right now. The stock is down 54% YTD, despite being the highest quality midstream operator in America.
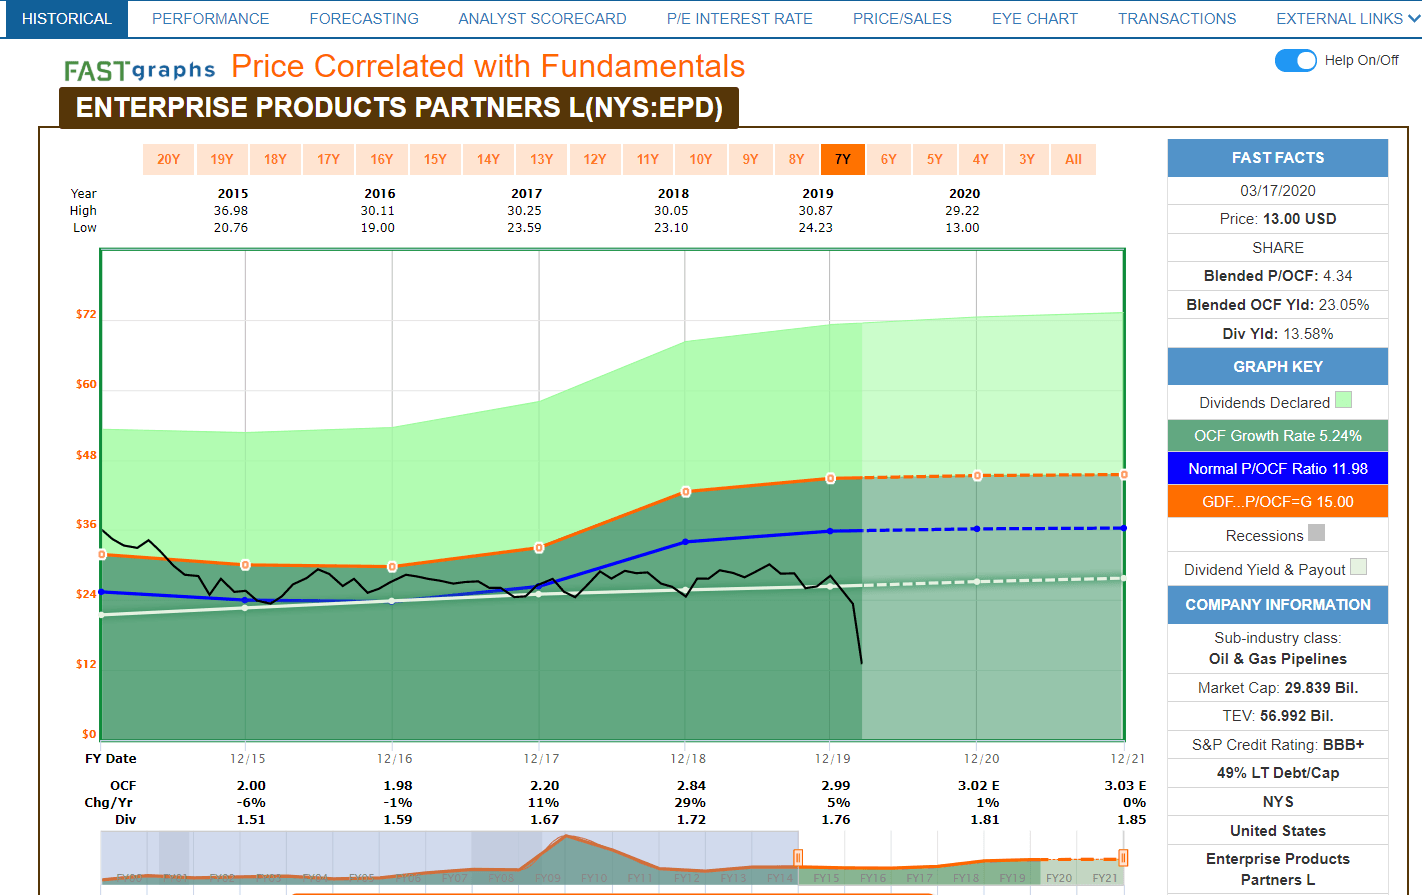
(Source: F.A.S.T Graphs, FactSet Research)
Now EPD is not 100% immune from the collapse in oil & gas prices. About 15% of its cash flow is sensitive to commodity prices, which is likely why the consensus cash flow growth for this year is down to 1% compared to 6% at the start of the year.
However, here are the important things to note.
- 1.67 consensus coverage ratio in 2020 vs 1.2 safe and 1.4 very safe for self-funding midstreams
- long-term growth consensus (2.1%, Ycharts 5.1%) unchanged since before the pandemic
- distribution still very safe – 2008 credit market stress was over 2X more severe yet EPD kept raising the payout every quarter as it has for 15 consecutive years and 21-year payout growth streak
You know what other evidence we have that the market is dead wrong about EPD?
EPD Management Has Bought $16 Million Worth Of Stock Since Bear Market Began

(Source: Openinsider)
No one knows EPD’s business better than management, which owns over $10 billion worth of the stock that is paying them $1.3 billion per year in steadily rising distributions.
The same is true for ET, which pays CEO and founder Kelcy Warren $317 million per year in distributions.
ET Insiders Have Bought Over $100 Million Of The Stock Since Bear Market Began
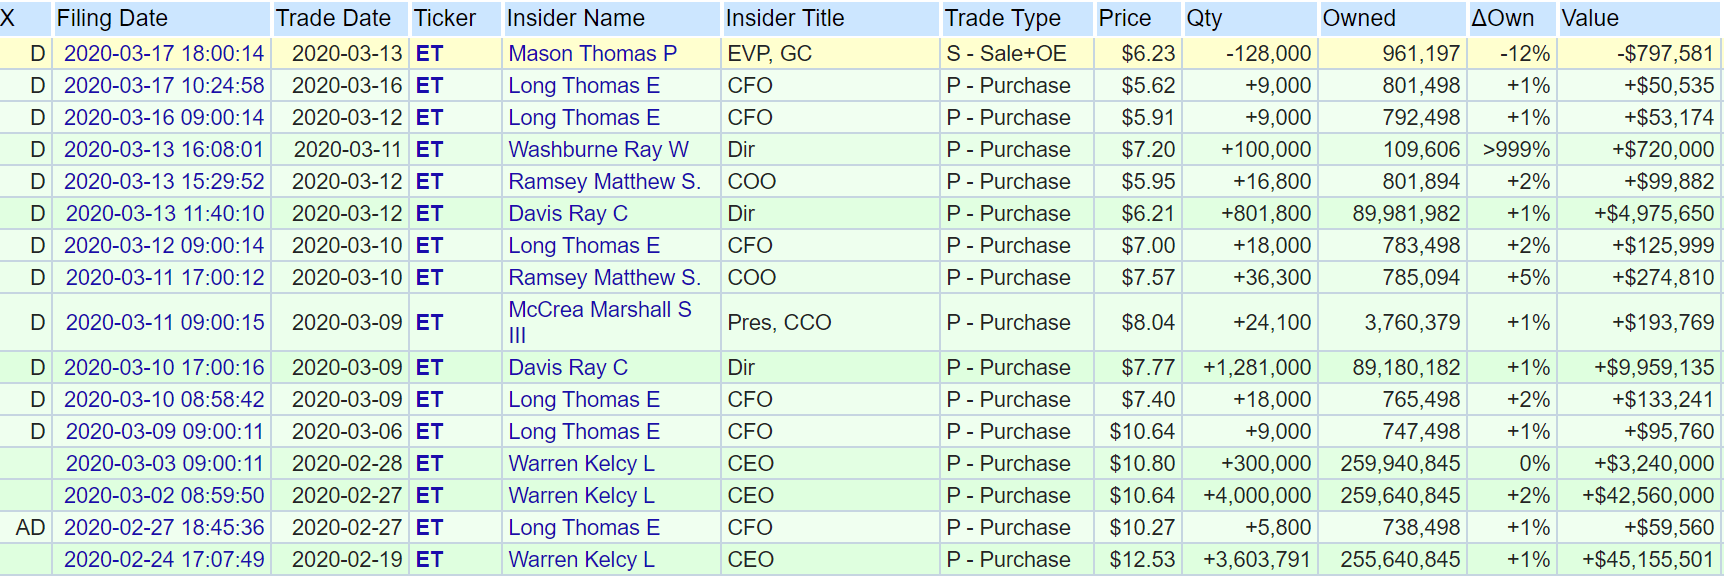
(Source: Openinsider)
So what might explain why even the bluest of midstream blue chips is falling off a cliff right now, despite objectively strong fundamentals and an unchanged long-term growth outlook?
Most likely two things.
Hinds Howard is Seeking Alpha’s midstream guru and explains that MLP CEFs and ETFs are a major reason for the industry’s rapid price collapse, which is not supported by the fundamentals.
Safe names like ET, EPD, and MPLX represent the largest MLPs in America. They are top 5 holdings of virtually every industry CEF/ETF. CEFs are legally allowed to be 40% leveraged and currently, massive redemption demand is causing ETFs and CEFs to sell en masse, regardless of price, valuation, fundamentals or common sense.
CEFs are also deleveraging which is adding to the forced selling.
When the forced selling abates and perhaps after there is a rally in oil prices and energy stocks, MLPs and Midstream should see a substantial bounce from very oversold levels.” – Hinds Howard
Now the other major reason for midstream weakness right now is oil prices.
I explain the reasons for that in detail in this article, as well as my plans for frequent safe midstream list updates to carefully monitor and ensure that each name’s quality/safety ratings remain appropriate.
- I check 2020 cash flow consensus and this year’s coverage ratio
- I monitor credit ratings for downgrades from S&P
- I monitor overall credit market conditions vs BBB risk premium, bond yields (for signs of a global liquidity crunch) and the St. Louis Financial Stress Index
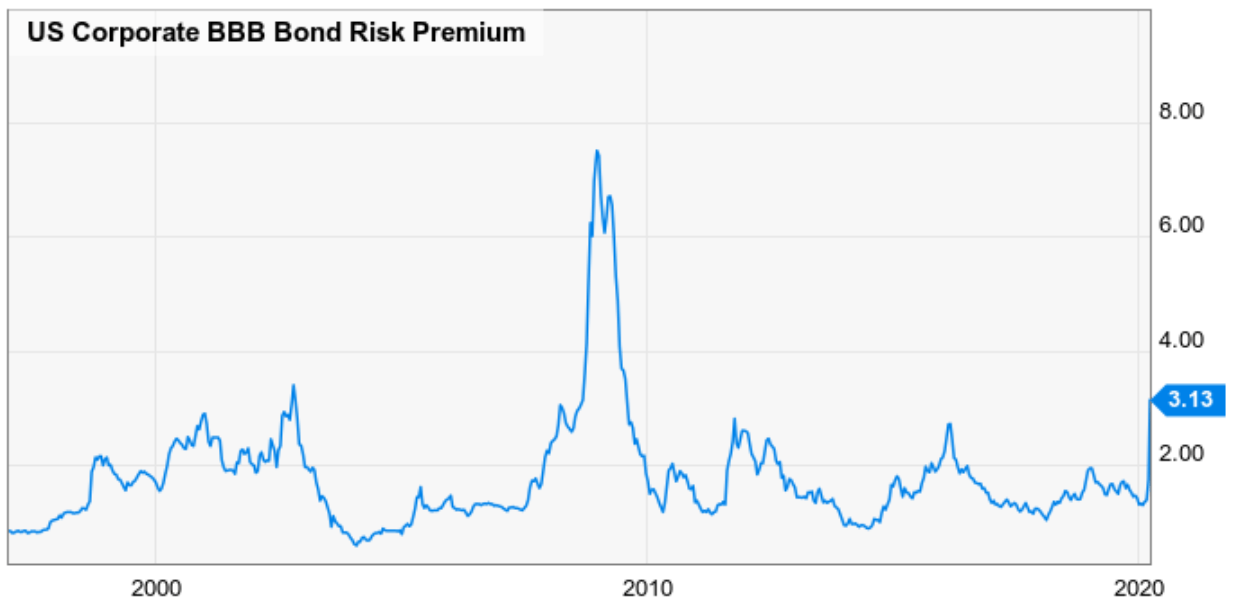
(Source: Ycharts)
Right now the corporate bond market is pricing in a recession, as seen by the BBB risk spread (average BBB bond yield -10-Year US Treasury Yield) rising to 3.13%. That’s a level normally seen in recessions.
In the event that credit conditions get bad enough (4+% BBB risk spreads) I will begin downgrading Master List companies at the highest risk of liquidity crises on the following schedule.
- 4% BBB risk spread: all junk bond rated companies on the list become “speculative”
- 5% BBB risk spread: all BBB- rated companies become speculative
- 6% BBB risk spread: all BBB rated companies become speculative
BBB+ or higher companies tend to not experience liquidity crises, as seen by Realty Income and EPD’s dividend track records in the Great Recession (both were BBB+ at the time).
REITs and midstream are very capital intensive businesses, with naturally higher leverage. It was mostly BBB+ rated REITs and midstreams that sailed through the Financial Crisis without cutting dividends.
I’m also watching the bond market for signs of a liquidity crunch. Long-term US treasuries are “risk-free” assets, and normally go up in value when stocks are declining.
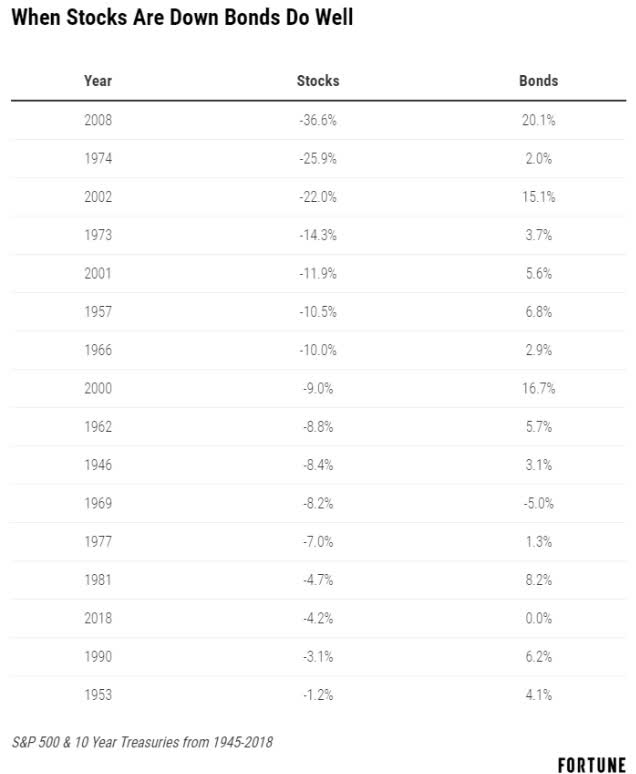
That’s true of 92% of years when stocks fall.
(Source: Nick Maggiuelli)
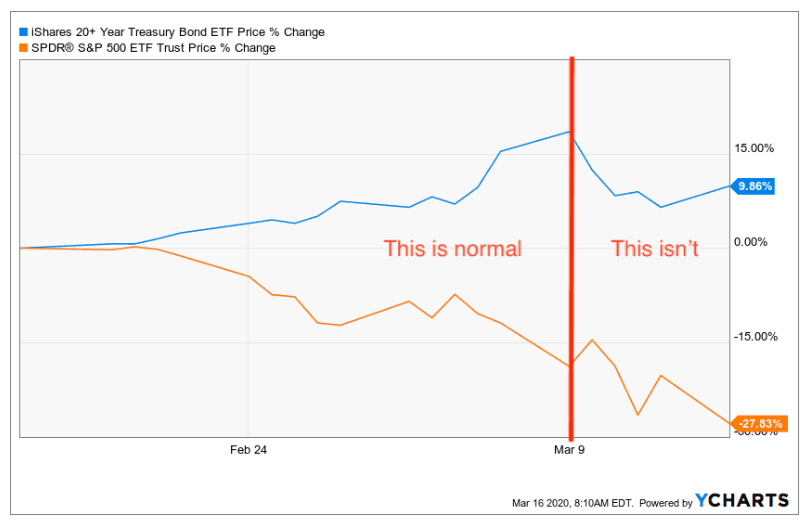
Recently that hasn’t been the case, with long bonds declining, likely due to institutions selling them to raise cash. This is one of the major reasons the Fed is acting with such aggression right now, pumping trillions into credit markets to prevent a financial crisis from forming.
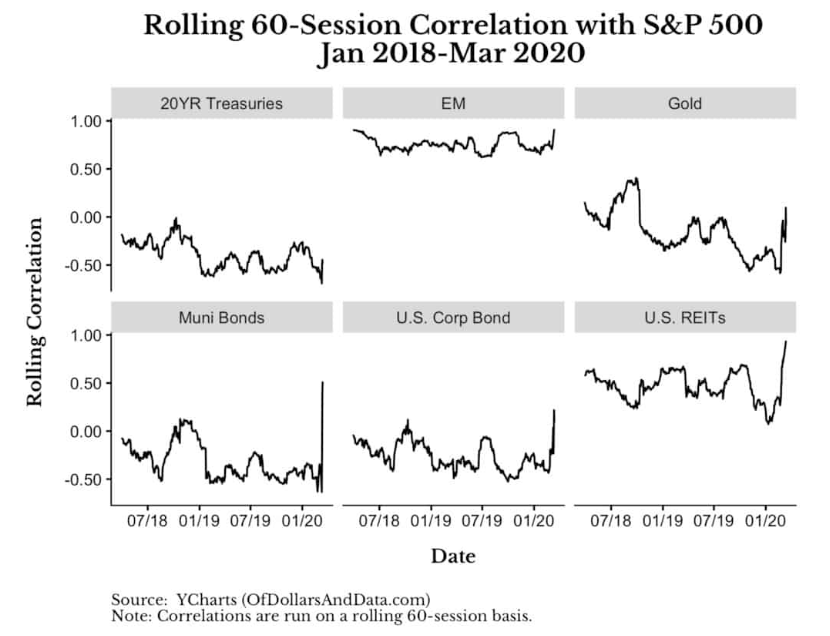
When all correlations move to one, even safe-haven assets like US bonds and gold, that’s a potentially troubling sign.
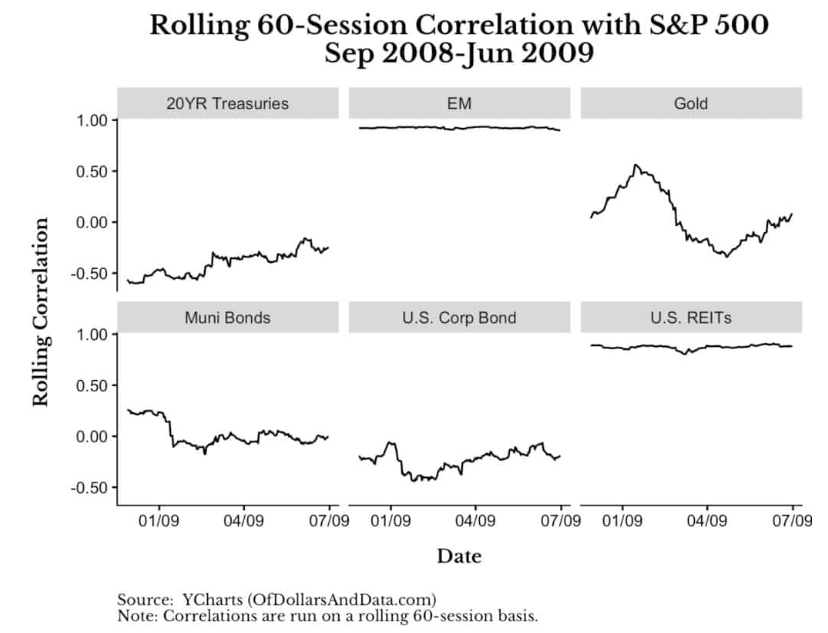
Here’s Nick Maggiulli, a Data Scientist for Ritholtz Wealth Management, explaining what these rising correlations mean.
Not 100% sure since we don’t have much data to go on, but it suggests that investors are cashing out entirely. They are forgoing bonds (the traditional safe haven) and moving to cash.
This is why everything seems correlated now. Individual stocks are moving with their stock indices like never before, risky assets are moving together, and even bond assets are now starting to selloff as well.
I don’t have enough data to prove this definitively, but, in the coming weeks, we will be able to determine whether investors are cashing out en masse. Like most things nowadays, we will just have to wait and see what the data tells us…
Maybe some of these investors own a business that is being negatively impacted by coronavirus (i.e. travel, hospitality, etc.) and they are cashing out to cover expenses or lost revenue. Others might be cashing out to hedge against expected job loss or some other adverse outcome.
Unfortunately, the best answer I can give you is: I don’t know.” -Nick Maggiulli, (emphasis original)
The point is that I am monitoring conditions closely, including the oil market, which offers the bleakest short-term outlook right now.
IHS Markit expects the ‘largest-ever oil glut’ to be between two and four times bigger than the 2015-2016 glut of 360 million barrels. All of this is happening at a moment that global crude demand is tumbling. Analysts even believe that the current drop in oil demand will turn out to be the most dramatic decline in history…
In an interview with Bloomberg, Matt Johnson, Chief Executive at Primary Vision, an industry data tracker, says that E&P spending could come down 40 percent before the end of the year and that, in the Permian alone, 1,500 to 3,000 oilfield service jobs could be at risk of disappearing in the next two months. ” – Tom Kool (Oilprice.com Head of Operations)
Morgan Stanley has cut its 2020 price target for oil from an average of $35 in Q2 to $30.
According to Reuters, here is what Morgan Stanley expects in the short-term,
“Temporary sell-offs to even lower levels are possible, if not likely… Despite the sharp decline in oil prices, it is unlikely that OPEC+ countries will return to the negotiation table anytime soon … We expect that much of the announced volumes will indeed come to the market, at least for a short period.” – Reuters
Barclay’s has reduced its average 2020 WTI price estimate from $43 to $40.
Goldman is the most pessimistic. The investment bank said last week we could see Brent fall as low as $20 a barrel if the oil price war between Russia and Saudi Arabia continues long enough…
“The prognosis for the oil market is even more dire than in November 2014, when such a price war last started, as it comes to a head with the significant collapse in oil demand due to the coronavirus.”- Oilprice.com
Oil bottomed at $26 in 2016 after a 2.5-year decline. It is now about $24.5 the lowest price in 17 years. That’s after the fastest decline in history, created by two black swan events, the pandemic, and the Saudi/Russian oil war.
The good news is that the price war/pandemic effects are expected to start receding as soon as the virus and its economic damage does. That should ensure that oil prices don’t keep falling for the 12 to 24 months most industry experts (including Morningstar) and oil CEOs expect the oil crash to last.
However, this is a very important fundamental event for most energy companies. Next Tuesday I’ll be updating all oil & oil service companies in the Master List for their latest cash flow consensus estimates and checking credit ratings (XOM has already been downgraded from AA+ to AA by S&P).
- all oil stocks are now “speculative”
- almost certainly all will receive 1 to 2 point quality/safety downgrades anything that becomes a 6/11 below-average quality company (such as HP), will be moved to the new “fallen angel” list and removed from the Master List.
The Fallen Angel List is where I keep the companies whose fundamentals have become unsafe (6 or lower quality) due to the pandemic.
It represents companies that I consider a “hold” during the crisis but may return to the list when economic/industry conditions improve.
Park Hotels and Resorts (PK) is the first name on the fallen angel list, after suspending its dividend to conserve cash during the crisis.
Rest assured that I’m updating companies as fast as possible each week, and reporting any quality/safety/speculative rating changes in
- Monday’s “Companies’ We’re Buying Now” series
- Tuesday’s Master List update series
If a company’s long-term outlook (the thesis) breaks entirely and it becomes a “sell” you’ll hear about it, in those articles as well as on the chat board in real-time.
BUT I have to stress that thus far no company’s thesis that I’ve updated has broken entirely from this temporary crisis.
Certainly none of the Correction Watchlist companies which I update each Monday, and would quickly know if they became fundamentally inappropriate for our members.
Bottom Line: No One Knows When This Will End, But If You Can Ride Out The Pain Your Long-Term Rewards Will Be Immense
What is happening now is unquestionably concerning, from a global health perspective, as well as a short-term economic one.
But the Dividend Kings are here to get you through these difficult times. Not by merely cheerleading and giving you false hope like “it will soon be over”.
No one knows when this pandemic or contraction in our economy will end, thus the reason for historic levels of volatility and fear.
But what I can promise you is this
- the pandemic will end eventually.
- the short-term contraction in economic and corporate earnings growth will be likely followed by a very strong recovery.
- the current bear market will likely be followed by a very strong recovery in stock prices, once the uncertainty/fear abate.
- long-term investors, who stick to the reasonable and prudent risk-management plans in place before this crisis began will not just survive financially but thrive in the future.
Right now the media is awash in scary headlines, including hyperbolic claims that are especially unnerving because of the lack of hard data we have to counteract them.
This is why I’m spending 14 to 18 hours per day not just writing articles for DK and Seeking Alpha, but gathering reliable and reputable news/data from every source I know of.
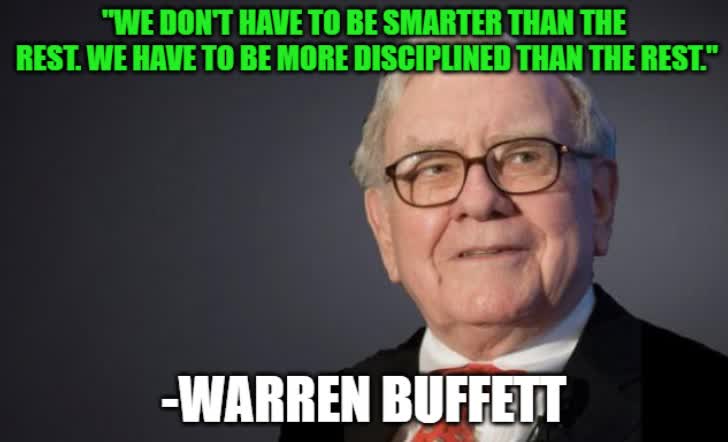
This quote from Ben Graham, the father of value investing, exemplifies our approach at Dividend Kings.
As Chuck pointed out in his most recent article, good investing requires a pragmatic view. That means focusing on the best available evidence we have and making short-term decisions about your savings from a long-term perspective.
Rest assured that my frequent updates about the state of the pandemic/economic/corporate earnings effects will continue.
- I update the COVID-19 Final Case Forecasting Tool daily on the chat board
- the forecasting tool is updated each Friday along with all our tools
- I’m updating about 80 companies per week in the Master List with the latest safety/quality scores based on consensus forecasts, debt metrics/credit ratings
- I’m watching the credit markets closely, including bond markets, St. Louis Financial Stress Index, and BBB-risk spreads and will adjust the Master List ratings as needed for current credit market conditions.
Basically, the Dividend Kings are the best source of fact/evidence-based long-term investing advice you can find in this time of intense uncertainty and market fear.
I have two mottos I live by, and which drive all my articles,
- quality first, valuation second and prudent risk management always.
- only be as concerned as the facts say is prudent and never panic.
The cure for fear is facts. While we may not have as much of those as we’d like right now, rest assured that we’ll be sharing those with members each week, as soon as we get them.
Meanwhile, stick to your long-term plan, which has a risk management strategy that was prepared for this crisis.
Not in that “we saw the pandemic/bear market coming” but merely because a properly diversified and risk-managed portfolio is prepared for recessions/bear markets, whatever the cause.


