
Every week we’re being inundated with conflicting economic/market/earnings data that causes permabears and permabulls to crowd the financial media airwaves with dire/euphoric predictions of market crashes/melt-ups.
A quick example is recession risk.
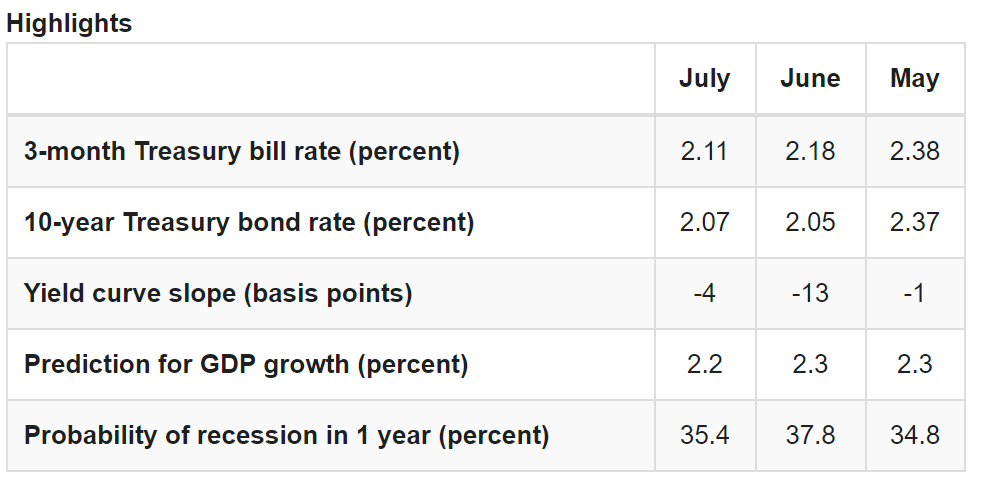
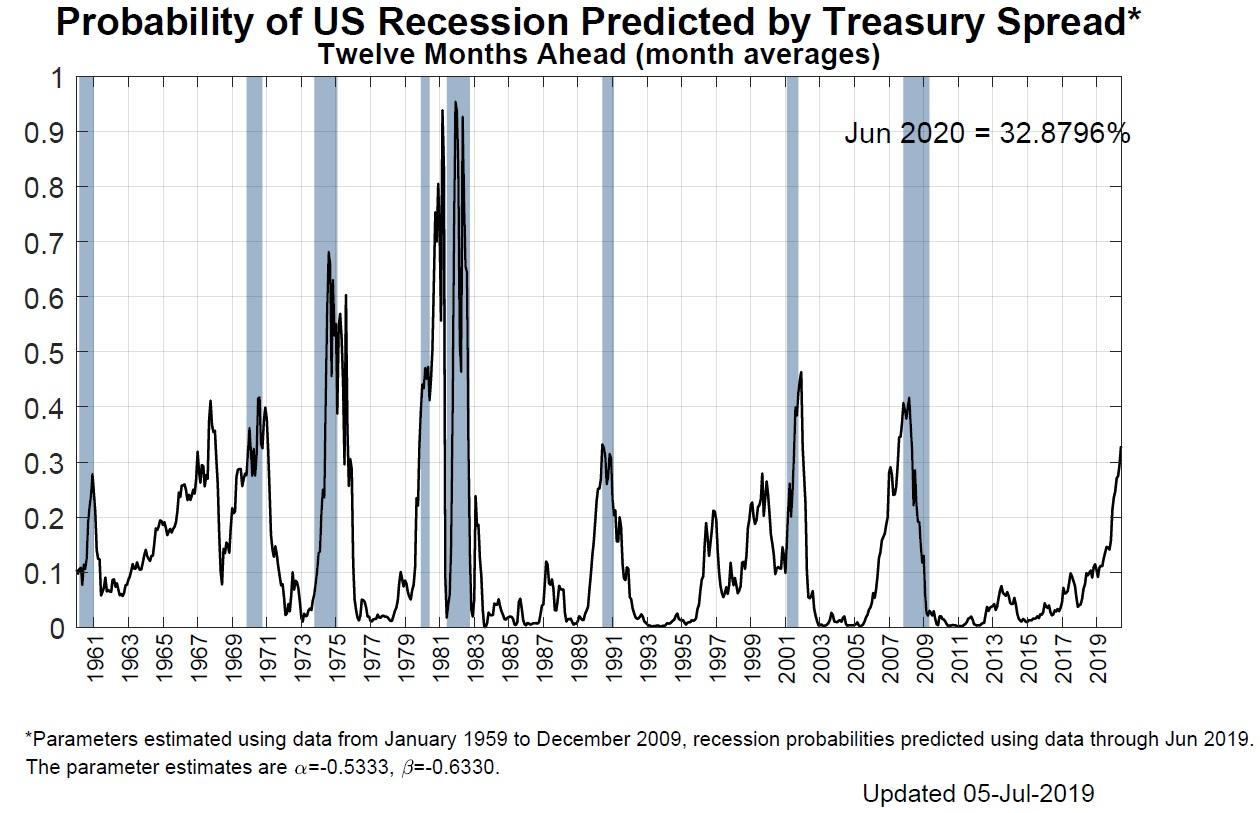
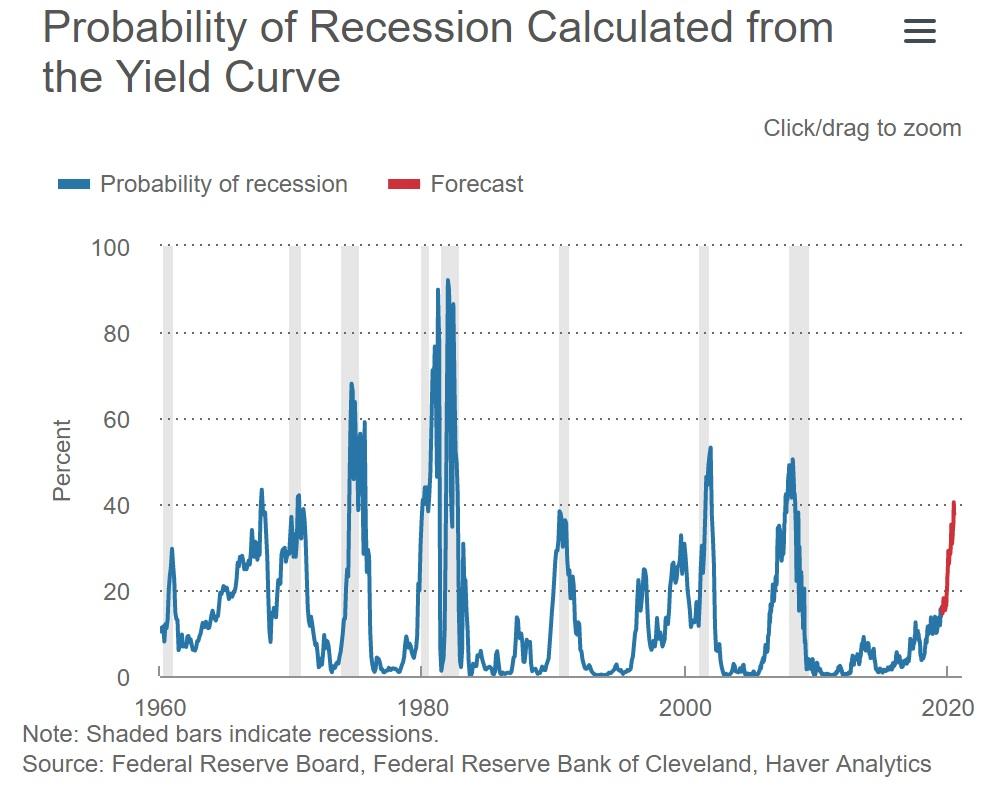
(Sources: Cleveland and NY Federal Reserves)Right now the Cleveland and NY Fed recession/economic growth models estimate a 33% to 35% probability of a recession beginning within a year. Economic bears point out that since 1950 whenever risks have gone above 30% a downturn almost always followed soon after.
Sounds scary, but the Cleveland Fed model also indicates that recession risk may have peaked and is now declining.
(Source: Cleveland Federal Reserve)
What’s more, the Cleveland Fed estimates 2019 GDP growth of 2.2%, the exact estimate the NY Fed has for Q3 GDP growth (Q2 was 2.1%). The global economic consensus is for 2.5% growth in 2019 and 1.5% in 2020 (even without a trade deal). Slower growth yes, but not close to a recession.
(Source: Marketwatch)
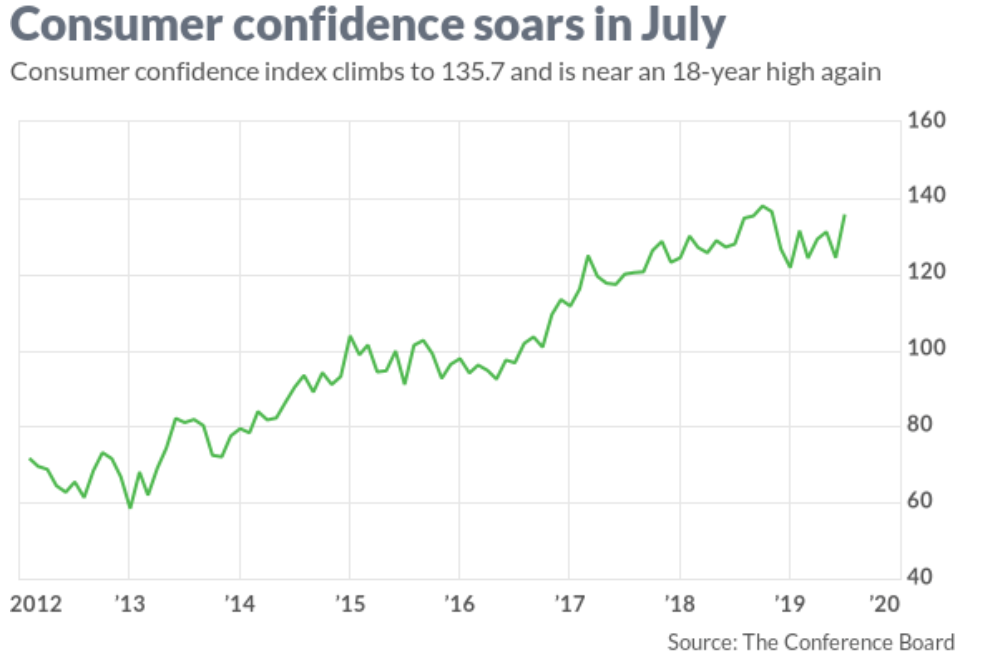
Meanwhile, consumer confidence, a key driver of consumer spending (about 70% of the US economy) has recovered to 18-year highs. That’s due to a strong job market with ADP/Moody’s reporting 156,000 net private jobs created last month vs 150,000 expected. According to Mark Zandi, the chief economist at Moody’s Analytics
“Job growth is healthy, but steadily slowing…Small businesses are suffering the brunt of the slowdown. Hampering job growth are labor shortages, layoffs at bricks-and-mortar retailers, and fallout from weaker global trade.”
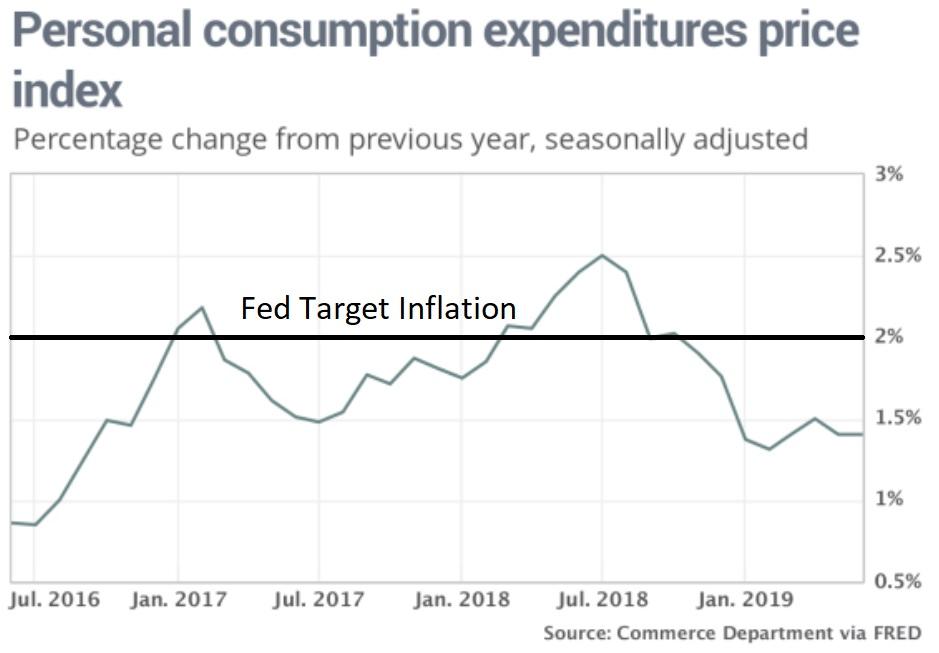
At the same time that, despite tariffs, core PCE, the Fed’s official inflation metric just came in at 1.4% YOY last month.
That’s well below the Fed’s official 2% long-term symmetrical target rate and frees the Fed to cut interest rates however many times is necessary to prevent a recession. Fed officials’ latest comments (at various speaking engagements and Powell’s testimony to Congress) indicates that two 25 basis point “insurance” cuts are likely, in July and September.
Moody’s Analytics estimates that each cut stimulates the economy by 0.1% to 0.15% within 12 months of being enacted. This means that, theoretically, the Fed could boost GDP growth about 1% if it cut to zero.
So as you see, there are reasons to be bullish but cautious about the economy (as well as trade negotiations and corporate earnings). Sitting out uncertain times is NOT a reasonable approach, because time in the market is far more important than timing the market.
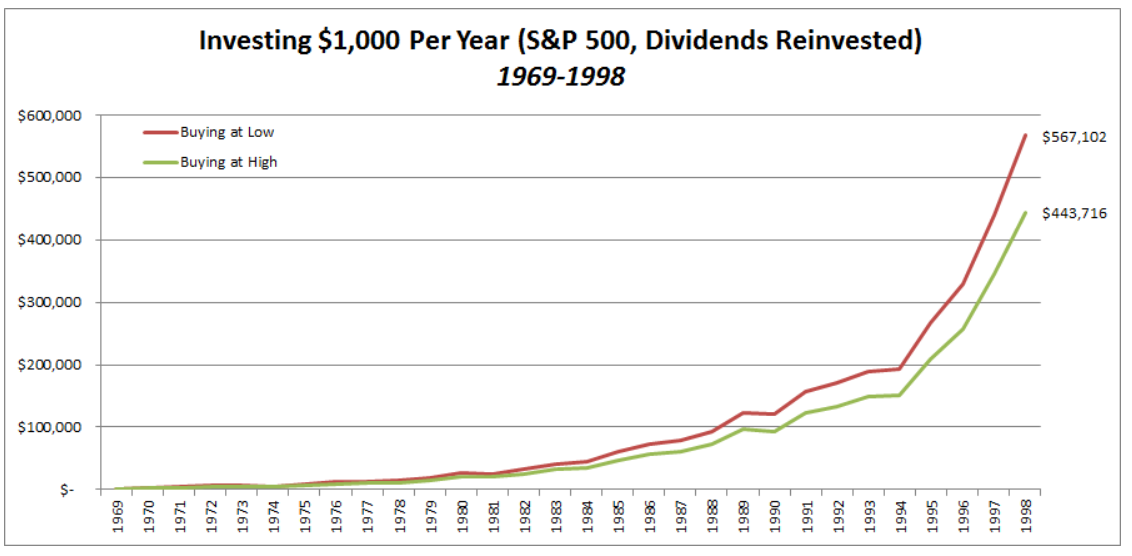
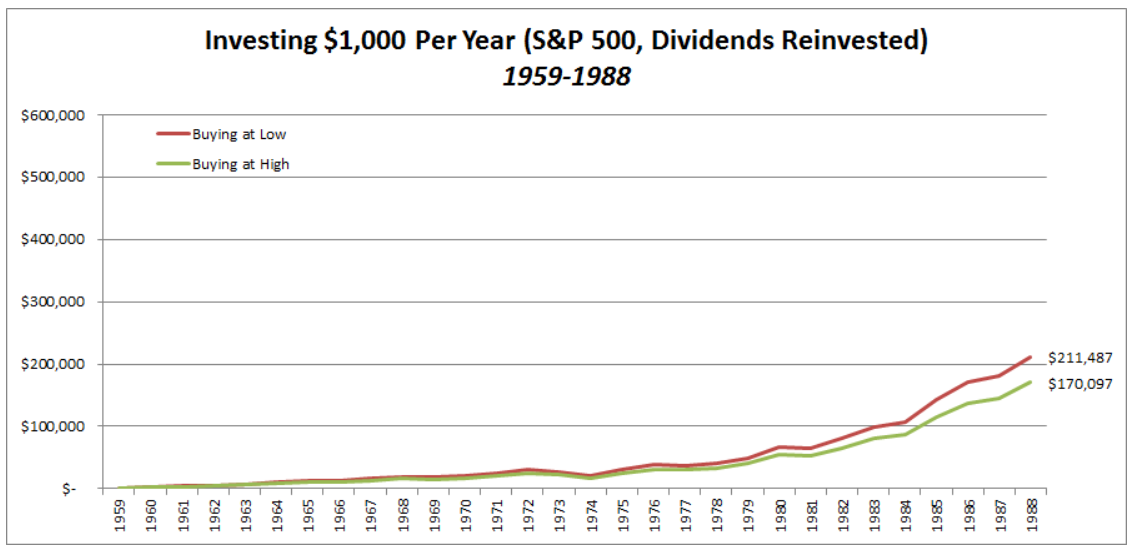
To show you why market timing is not just foolish, but unnecessary let’s look at a recent study by Albert Bridge Capital. They looked at what the effects would be over 30 years time periods based on two hypothetical investors.
- the perfect market timer (invested $1,000 per year at the market’s bottom in any given year)
- the worst possible market timer (invested $1,000 per year at the absolute highs of any given year)
The reason for comparing these two hypothetical investors is because the probability of actually achieving these feats is statistically impossible.
The odds of you picking that perfect (or worst) day each year for thirty consecutive years were (1/253)^30, or a one-in-1240 followed by another 69 zeros’ chance.” – Albert Bridge Capital
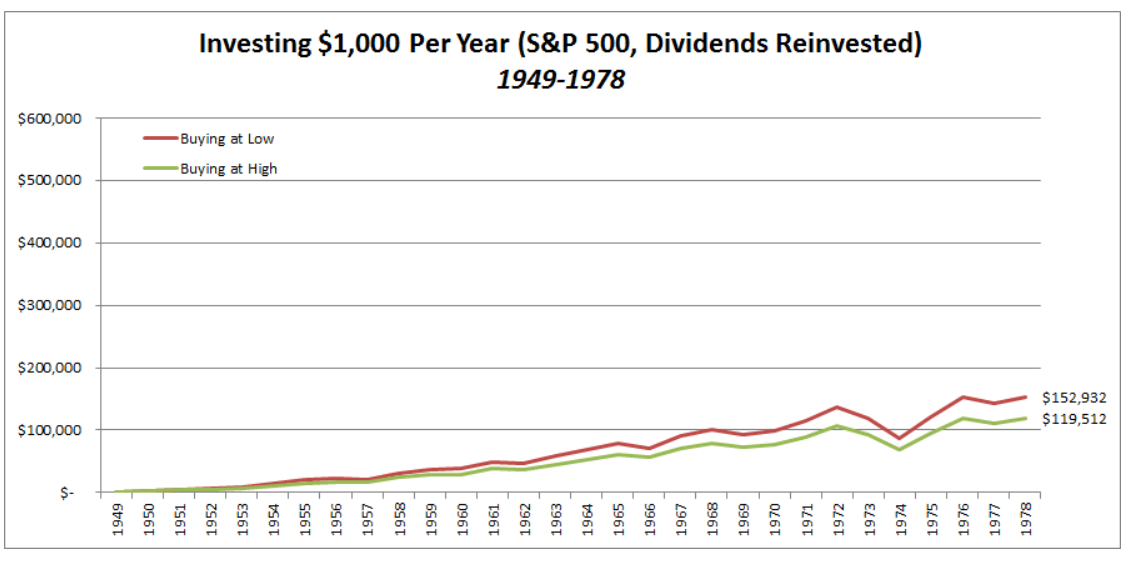
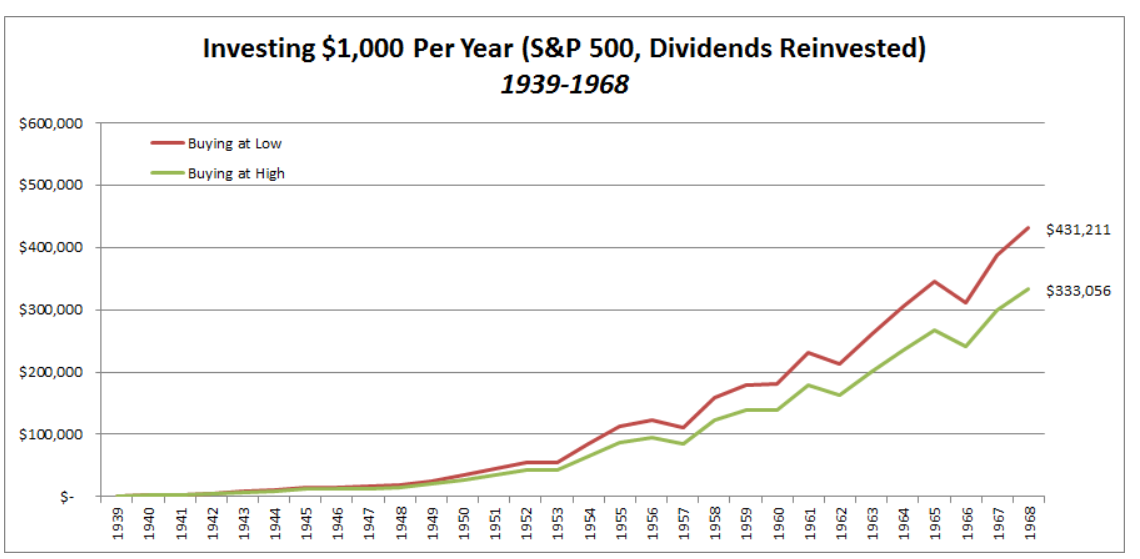
(Source: Albert Bridge Capital)
Even using literally the most extreme examples, of the best and worst possible market timing, no matter what 30 year time period you look at the results are not that different. What does this indicate? The power of long-term investing to compound your wealth is far more powerful than “perfection” in terms of when you buy income-producing assets. Or to put another way, steadily investing over time is the highest probability strategy to meeting your financial goals.
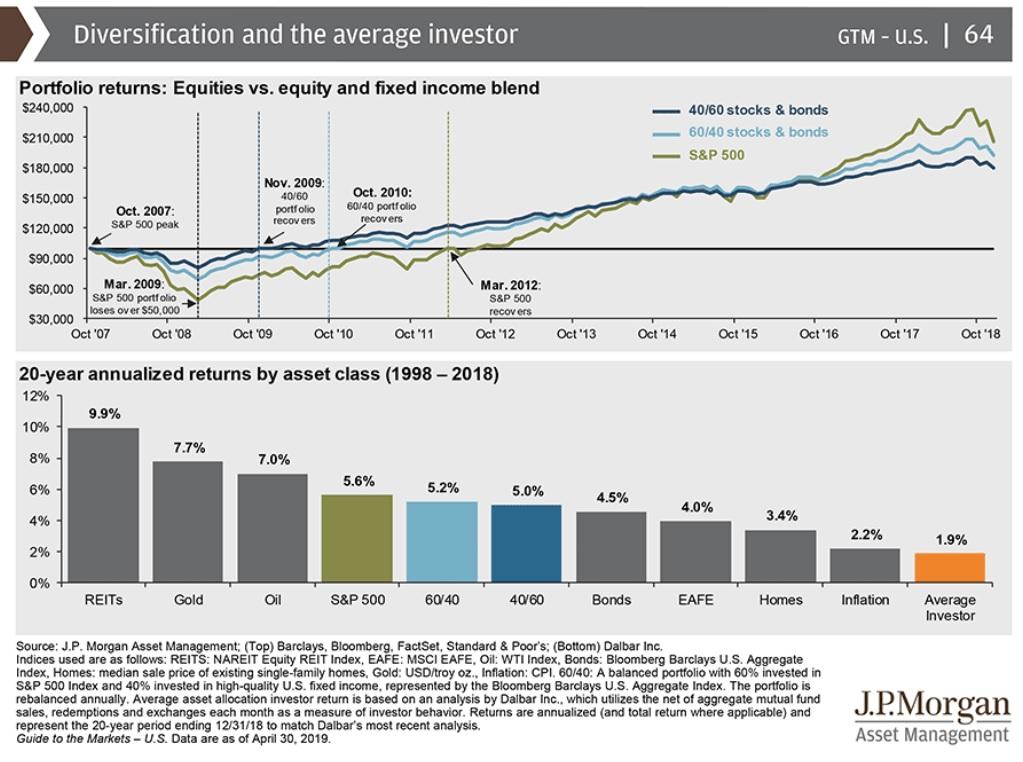
In contrast here’s what market timing gets you.
Despite two 50+% market crashes the S&P 500 still delivered modest returns over the last 20 years. The average retail investor saw slightly negative inflation-adjusted returns.
And according to the New York Times over the last 30 years, the average bond investor (using mutual funds they jumped in and out of trying to time the bond market) also achieved negative inflation-adjusted total returns. That’s despite a 35-year bond rally, literally the greatest in that asset classes’ history created by long-term rates falling from 16% in 1981 to a low of 1.36% post-Brexit vote in mid-2016.
The key to long-term success, and maintaining your sanity during periods of uncertainty (there’s always something to worry about) is proper planning, not perfect market timing (in either stocks or bonds).
As my fellow Dividend King Chuck Carnevale just pointed out in a wonderful article about retirement portfolio construction, sleeping well at night is all about a logical, step by step approach to maximizing the probability of achieving your long-term goals.
So I present a five-step guide to a SWAN retirement portfolio, a bunker portfolio that can help you navigate these (and future) uncertain times, including crazy short-term market swings and inevitable but unpredictable recessions and bear markets.
Step 1: Budgeting And Economizing So You Have Money To Invest At All
The first step to ensuring you will have the money you need to live comfortably in the future is actually having savings at all.
According to the Fed’s 2018 Report on Economic Well Being 39% of Americans don’t have an emergency fund that can tolerate a $400 unexpected expense without going into debt.
A 2017 CareerBuilder survey found that 78% of Americans are living paycheck to paycheck (even high-income families). No investing strategy will help you if you have zero savings, which is where proper budgeting comes in as the first step in long-term financial planning.
Let me give you a personal and painful example from my own life. Recently my Grandmother was diagnosed with her 6th reoccurrence of colon cancer. She’s valiantly battled her metastatic disease for years but is in such bad shape that she’s had to move in with me, so I can help care for her on a daily basis (and help with her medical bills). Due to the disruption of my work schedule (and huge increase in spending) my discretionary savings (what I can invest in the stock market) has been cut in half.
But thanks to a fanatical approach to keeping my costs low, rather than go into debt or see my monthly investments fall to zero, I’m still able to invest $1,750 per week ($1,000 into stocks the rest into cash/bonds based on current recession risk and my long-term plan that factors in future bear markets).
My monk-like spending habits are a result of years of grinding poverty I’ve experienced in the past (I once had to go a month without eating, living on mustard, pickle juice, and water). But keeping your costs low doesn’t have to be as extreme as what I do.
- Mark Cuban buys staples like toothpaste in bulk (sometimes two years worth) when he finds it on sale
- My father (who taught me about smart savings) buys all his families staples in bulk at 20% to 40% discounts at Costco, relative to grocery/convenience store prices
- My father buys all electronics (including smart phones and laptops) during Amazon Prime Day or the Black Friday discount season
Last year my phone died, and I had to replace it. Rather than spend over $1,000 to get a new flagship, I went with a refurbished LG V20 (a 2016 flagship and the last one ever produced with a replaceable battery). That cost me $150.
Recently a software error that baffled both T-Mobile and LG, caused that phone to die. I replaced it with the same model, also refurbished (found on Amazon) for just $90.
In the meantime, I used my father’s old 2017 Galaxy Note 8, a fantastic backup phone that meets all my needs and more.
The point is that my high savings rate is not due to denying myself the luxuries/necessities that make life worth living. Rather, like my father and Mark Cuban (and various other successful people), I’m smart about how I buy the same things most people do.
That means making sure to plan ahead, so we can buy the same exact products for far less money. Every dollar you save in this manner represents discretionary savings that can be put to work generating exponentially more income and wealth for you in the future.
Step 2: Proper Asset Allocation
In the coming weeks, I’ll be doing an article examining seven good ETFs you can use to profit from the 7 proven alpha strategies that have consistently beaten the market over time.
22 Year Total Returns For 7 Proven Alpha Strategies
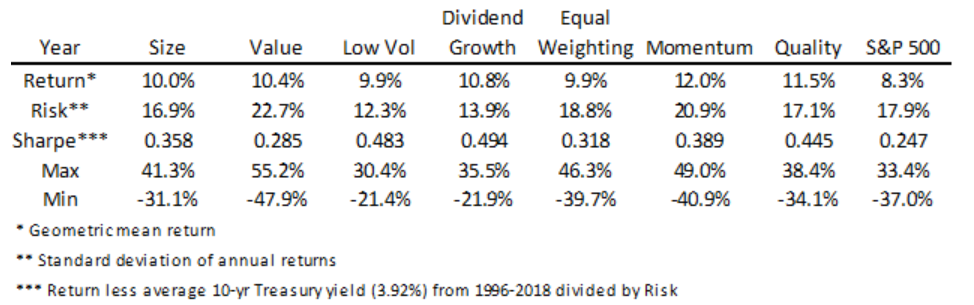
(Source: Ploutos Research)
But I want to use these seven strategies (and their ETFs) to make a point about the importance of proper asset allocation, the second step in securing your financial future.
The simple truth is that no investing strategy will work all the time. They tend to go in and out of favor depending on where we are in the current economic/market cycle.
Alpha Factors Tend To Perform Better During Certain Parts Of The Market Cycle
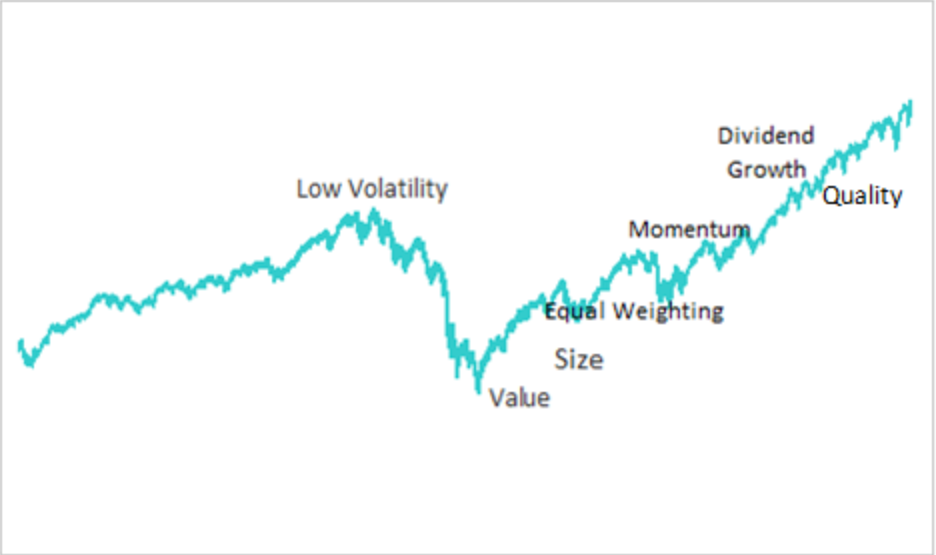
(Source: Ploutos Research)
And as I explained in the intro, there is no way to know when that cycle is about to end (with a recession/bear market). So a reasonable strategy for passive investors is to just own low-cost ETFs targeting all of these strategies.
Equal Weighting Of All Alpha Strategies 1996 To 2018
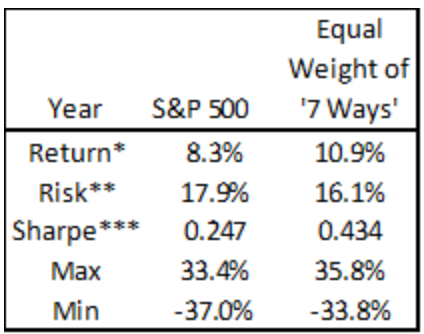
(Source: Ploutos Research)
Over the last 22 years, this would have resulted in superior total returns, with slightly lower “risk”, ie standard deviation or volatility. Mind your volatility risk is just one of three kinds that you need to keep in mind to protect your retirement nest-egg.
The peak decline of that equally weighted portfolio (in 2008) was 9% lower than the S&P 500, but still a gutwrenching 35.8%. This is why I’m so adamant about asset allocation because NO DIVIDEND STOCK IS A BOND ALTERNATIVE.
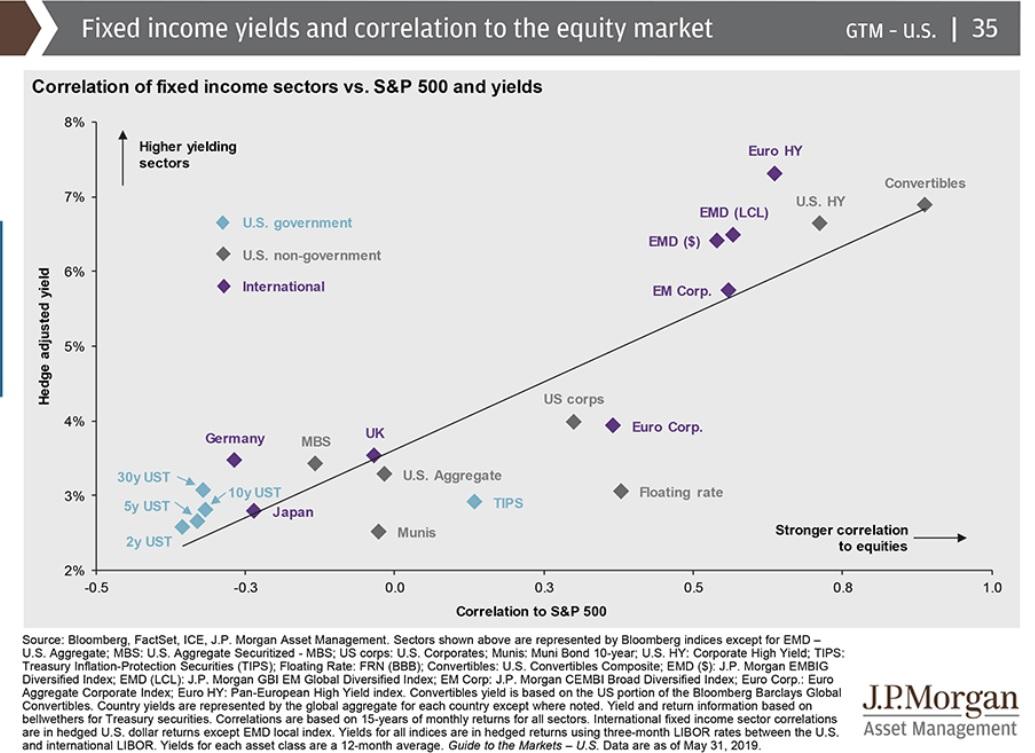
Bonds, specifically higher quality ones including sovereign debt, are generally less correlated and often negatively correlated to stocks.
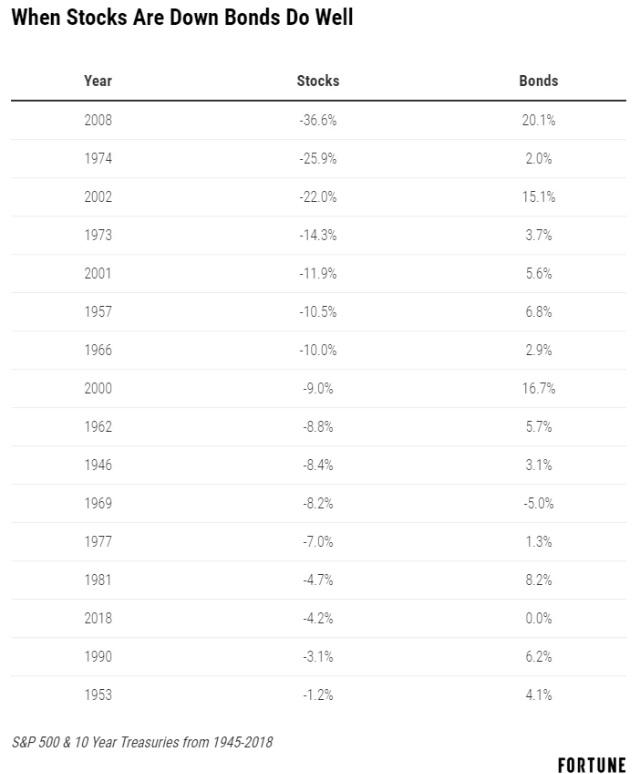 Which is why, since 1945 in 15 out of 16 years the S&P 500 has closed in the red bonds have remained flat or gone up. That even includes modest gains during the high inflation 1970s (inflation hit double digits).
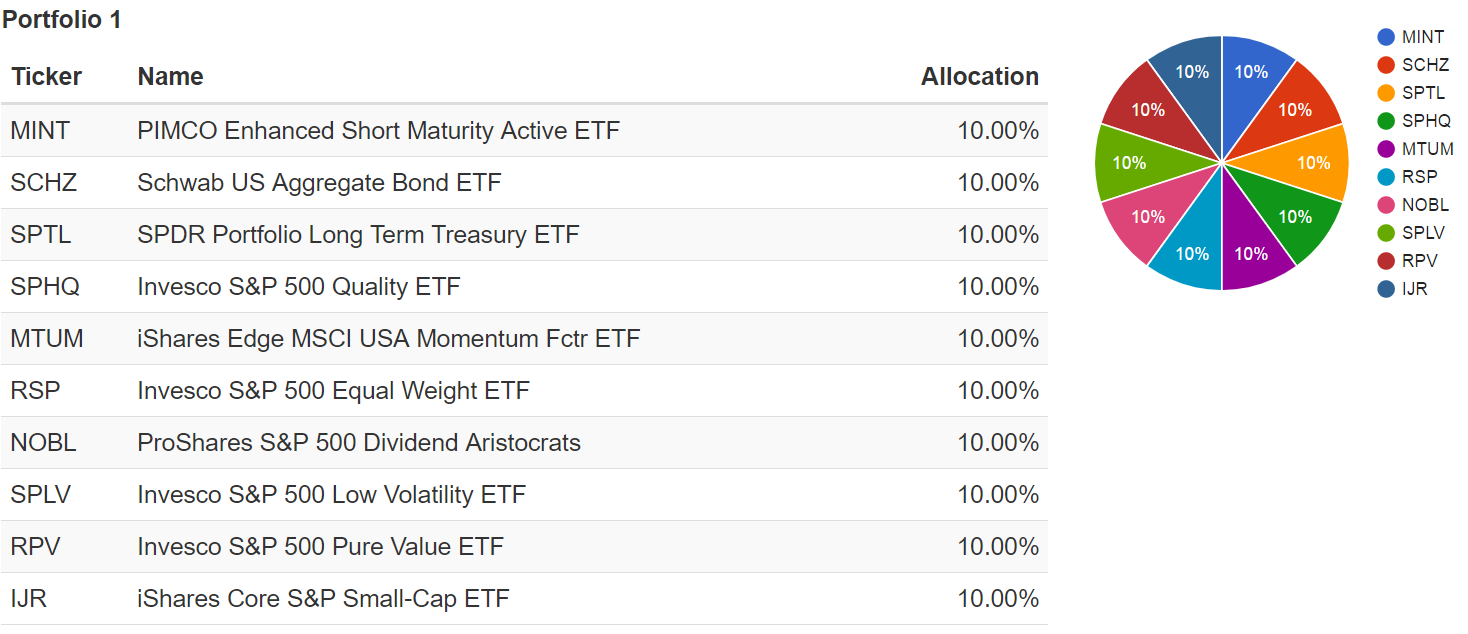
So let’s take a look at how those 7 alpha strategies ETFs would have done when combined with the 3 bond ETFs that Dividend Kings uses in our $1 Million Retirement Portfolio for our 30% bond allocation.
- PIMCO Enhanced Short Maturity Active ETF (MINT): cash equivalent Morningstar 4 stars-Gold Rating
- Schwab US Aggregate Bond ETF (SCHZ): intermediate bonds (a proxy for all investment-grade US debt) Morningstar 4 stars-Silver rating
- SPDR Portfolio Long Term Treasury ETF (SPTL): long-duration US Treasuries (our recession hedge) Morningstar 4 star rating
An equally weighted combination of those three ultra-short to long-duration bond ETFs has a duration of 7.9. That means that, should 10-year yields rise or fall 1%, that bond portfolio can be expected to rise or fall about 8%. It’s moderately rated sensitive and whether or not we experience a recession soon, represents a reasonable bond allocation that is likely to provide stable or appreciating assets to sell (if you’re living on some form of the 4% rule) in retirement (during a future stock bear market).
(Source: Portfolio Visualizer)
Given seven alpha factors and our three bond ETFs, that means a 10% allocation into each of these ETFs. The backtest data can only go back as far as the first full year in which each ETF has existed, which happens to be January 2014.
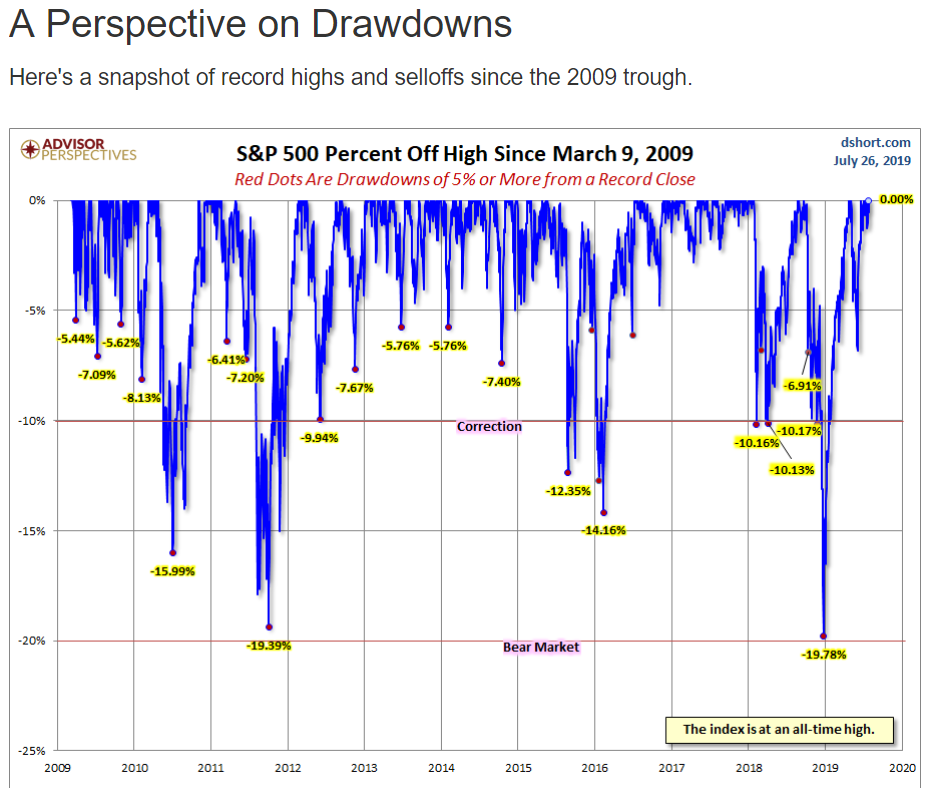
But there has been plenty of volatility since then, including five corrections, and four pullbacks of 5% to 9.9%.
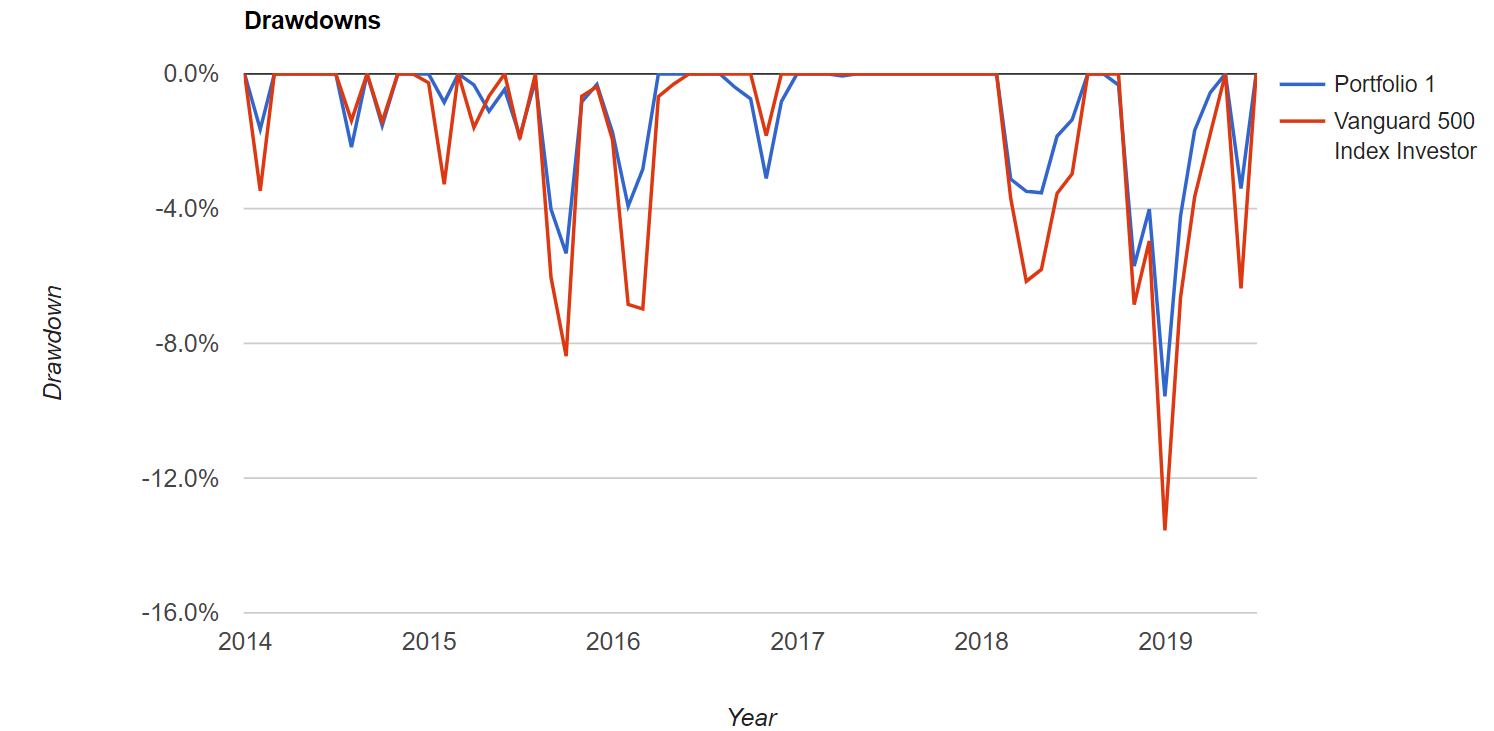
How did this balanced 7 alpha-factor portfolio do against the standard 60/40 stock/bond portfolio?
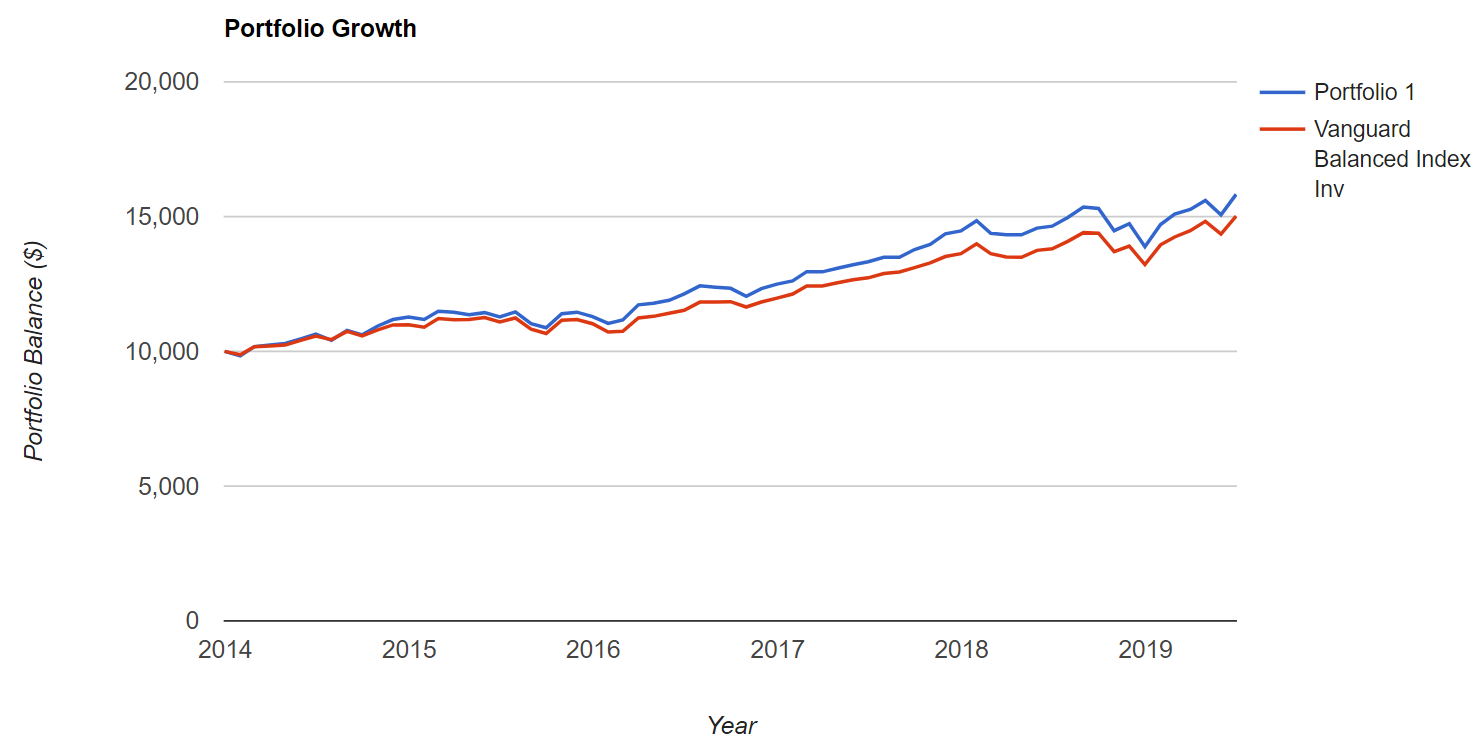
(Source: Portfolio Visualizer)
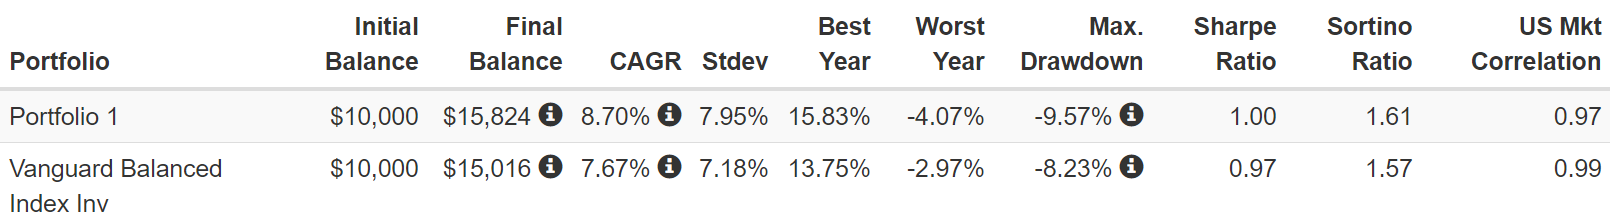
The portfolio beat the standard balanced portfolio by 1.1% annually, with slightly lower volatility, a peak decline of 9.6% (vs 13.6% peak 12 month S&P 500 decline) and slightly better risk-adjusted returns (total returns/volatility) and a modestly better reward/risk ratio (excess total returns/downside volatility).
(Source: Portfolio Visualizer)
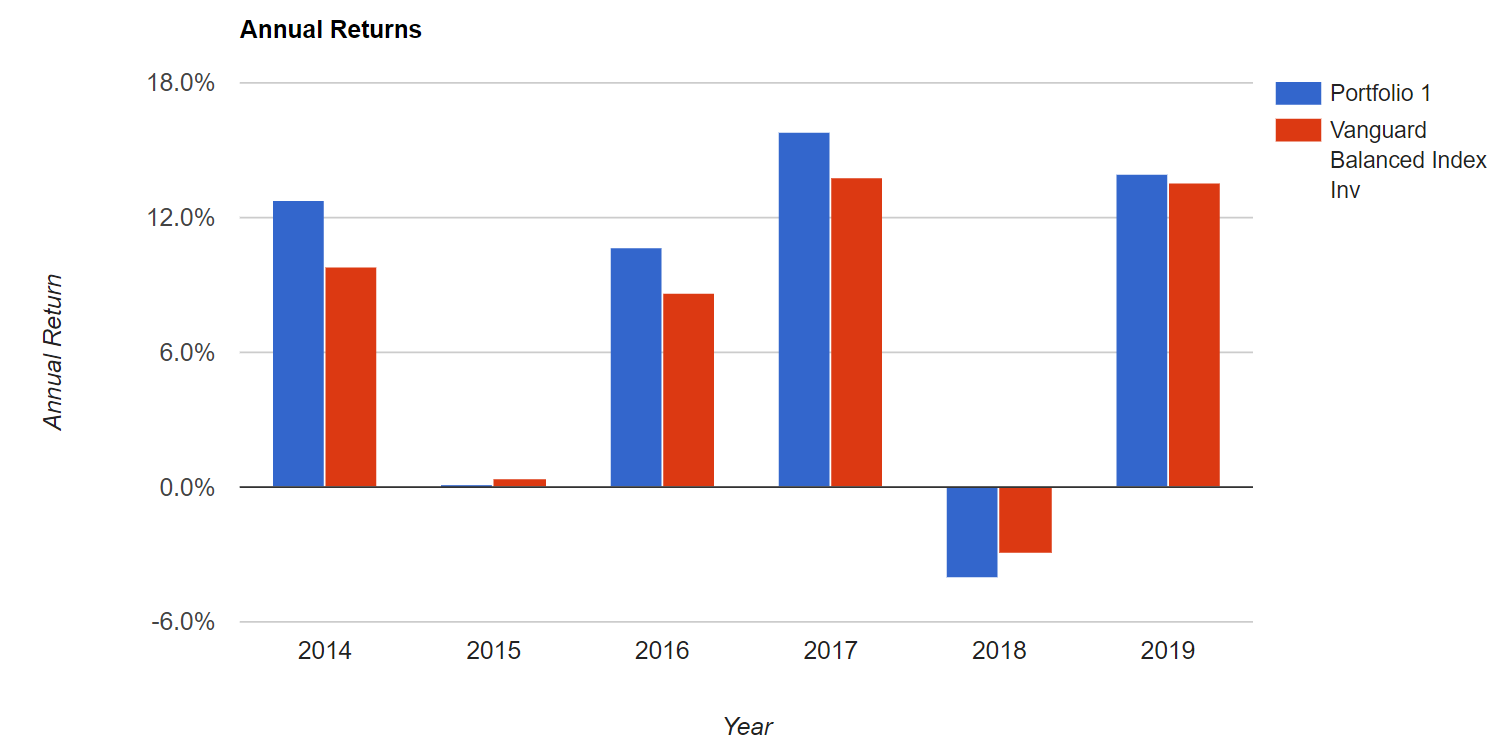
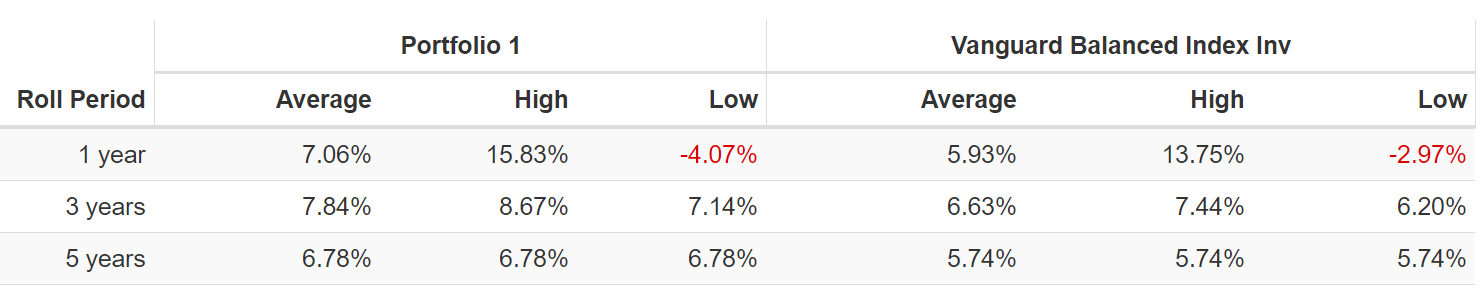
The portfolio beat the standard balanced portfolio in four out of the last six years, and the average rolling returns were similarly better across all time periods (largely thanks to our 10% higher equity allocation and a 10-year bull market).
The portfolio started out with a yield of 1.8% in 2014, and dividend growth raised that to 3.0% in 2018. This shows the limitation of passive investing, which sacrifices immediate yield for instant diversification and hands-off autopilot investing. This balanced portfolio had slightly higher peak declines (1.3%) due to being 10% more weighted to stocks.
(Source: Portfolio Visualizer)
But compared to a 100% S&P 500 portfolio it was less volatile, helping investors sleep well at night throughout our various short-term market freakouts.
The single worst monthly return for the portfolio was a 5.8% decline in December 2018 when the S&P 500 fell 9.0% (17% 3-week plunge offset by a massive rally in the last few days of the year).
The point is that proper asset allocation is crucial to good long-term planning, which is what you need to do well over time. After all, achieving your financial goals requires both the right plan and the ability to stick with it. The time to worry about market declines isn’t during pullbacks (like May’s 7% trade war fall), or December’s correction plunge (brought us within 0.2% of an official bear market).
It’s before you invest a penny of your hard-earned savings by creating a well-designed portfolio and long-term investing plan that won’t just do great during bull markets, but inevitable market declines as well.
Step 3: Stock (or ETF) Selection
There is a reason that Dividend Kings’ motto is “quality first, valuation second, and appropriate risk management always”.
Fundamental risk, valuation risk, and volatility/planning risk are all important, but fundamental risk (risk of permanent loss of capital) is what Buffett considers the true definition of risk.
Let me show you two examples of what I mean. CBL & Associates (CBL) is a classic example of a value/yield trap that suckered in a lot of people in recent years.
This owner of mostly class D and C malls (which are indeed dying), is burdened by excessive and junk bond rated debt. Its desperate attempts to revamp its stores in the face of numerous retailer bankruptcies forced the REIT to cut its dividend twice before suspending it entirely in March 2019 (due to a $90 million class-action lawsuit with creditors).
Yet some investors kept buying this level 5/11 quality company because, theoretically, it appeared dirt cheap (at least to them) and possibly a Benjamin Graham cigar butt style investment.
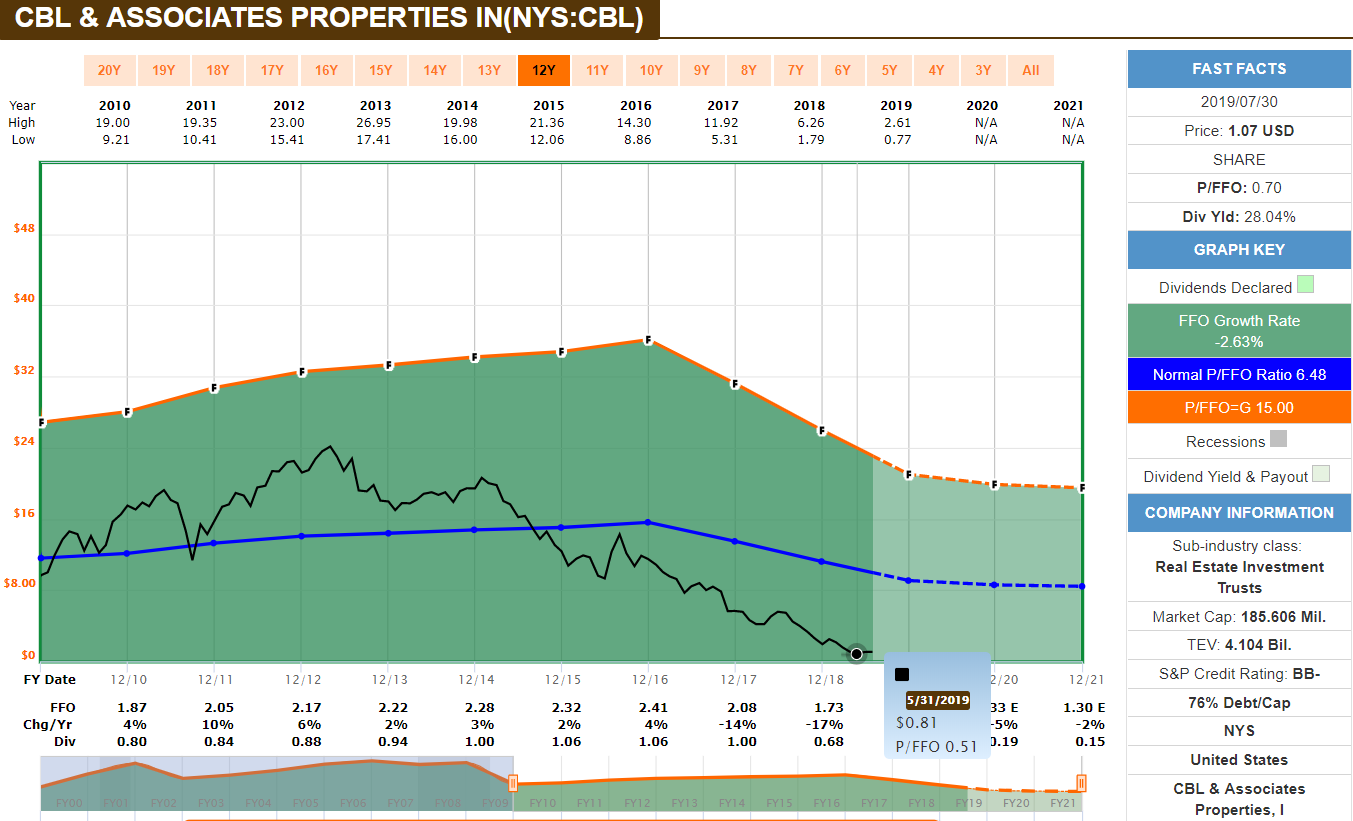
(Source: F.A.S.T Graphs)
CBL recently hit a price/FFO of just 0.5, a hypothetical cash flow yield of 200%. But notice that this junk bond rated, overly leveraged REIT, whose assets are very low quality and whose management is unlikely to right the ship, has delivered -2.6% CAGR cash flow growth over the past decade.
In recent years that negative growth has accelerated
- 2017: -14% FFO/share growth
- 2018: – 17% FFO/share growth
- 2019 analyst consensus: -19% growth
- 2020 analyst consensus: -5% growth
- 2021 analyst consensus: -2% growth
This explains why the market, which is never wrong about the “substance of a company” over 10+ years, has valued CBL at an average price to cash flow of just 6.5. CBL is at high risk of going bankrupt in a recession, in which case common equity owners get wiped out.
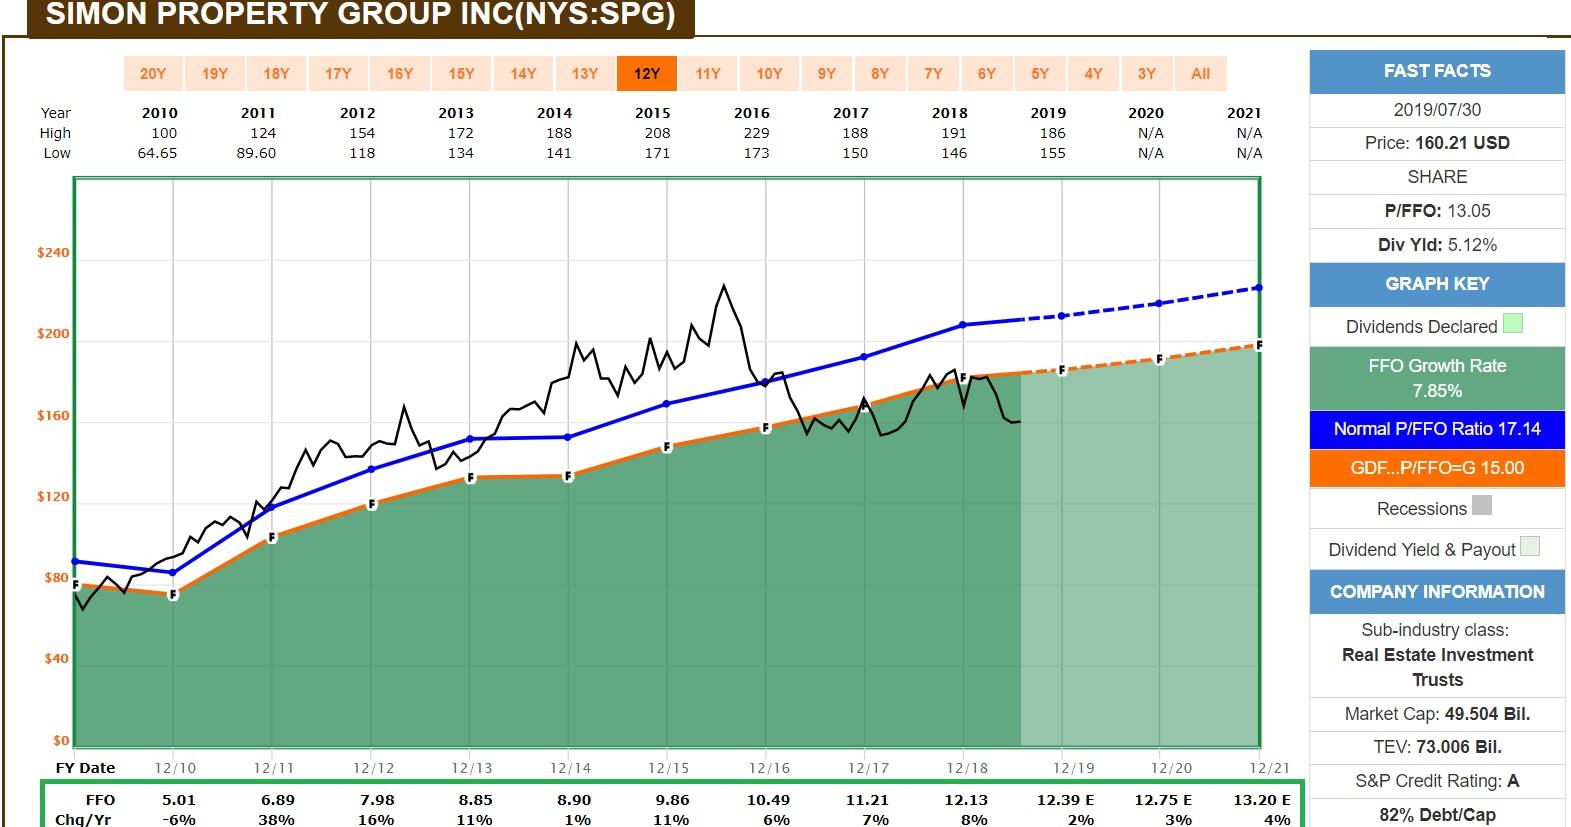
Now let’s contrast CBL, a value trap, with Simon Property Group (SPG), a level 11/11 quality Super SWAN mall REIT, which we own in three of our model portfolios (and recently added to when it fell to a 22% discount to historical fair value).
Simon owns some of the highest quality A-class malls in the country, (average sales per square foot $669).
SPG has posted positive cash flow growth every year since 2011 (once the Great Recession ended) including the entire so-called “retail apocalypse” which the media has been hyping and is why it now trades at 13 times cash flow vs a 10 year average of 17.1.
Simon just reported earnings and they were nothing less than sensational, from a fundamental perspective (the only one that counts in the long run).
- 2.5% dividend hike (sequential) = 5% YOY increase
- same-store net operating income up 2.0% YOY in Q2 and 1.8% YTD (2.0% full-year guidance)
- sales per square foot up 3.5% YOY
- 12 month least spreads (how much it hikes rent on new leases): up 32.3%
- FFO/share (adjusted for new accounting rules that went into effect this year): +4.9% YOY in Q2 and 7.3% YTD
- Current liquidity (borrowing power + cash): $6.8 billion
- Current growth projects under development: $1.7 billion
- repurchased 1,046,580 shares under its $2 billion buyback authorization (at deeply undervalued levels, 0.3% of all outstanding shares, in just one quarter)
- leverage ratio: 5.1 (vs 5.8 REIT average)
- interest coverage ratio: 5.1 (vs 3.4 REIT average)
Simon is a classic example of a wonderful company trading at a wonderful price and, in the words of Warren Buffett, is proving our “facts and reasoning” right quarter after quarter.
Lease spreads last quarter were 27%, and this quarter 32%. That’s due to Simon replacing failed tenants like Sears with thriving ones who are now paying far more rent. This is a testament to the quality of its properties, who have averaged close to 15% lease spreads since 2004.
The balance sheet is a fortress, which is why Simon is one of the few REITs with an A credit rating from S&P. SPG is retaining $1.5 billion in post dividend cash flow this year, to reinvest as part of its $1.7 billion improvement/growth backlog.
Over the coming years, management is guiding for about $1.5 billion in annual redevelopment spending, which it can basically fund entirely with retained cash flow (a self-funding REIT is a rare thing). But in reality, the nearly $7 billion in low-cost borrowing power will be tapped so Simon can repurchase deeply undervalued shares at cash flow yields of 7.7% (basically equal to its redevelopment project ROIC but instantly accretive to FFO/share).
How can you tell the difference between a value trap and a good deep value stock (adjusted for quality?).
Dividend Sensei Valuation Quality-Based Guidelines
| Quality Score | What It Means | Buy At | Strong Buy At | Very Strong Buy At |
| 7 | Average quality (factoring in all quality metrics) | 20% discount to fair value | 30% discount | 40% discount |
| 8 | Above-average quality | 15% discount to fair value | 25% discount | 35% discount |
| 9 | Blue Chip quality | 10% discount to fair value | 20% discount | 30% discount |
| 10 | SWAN (above average blue-chip) | 5% discount to fair value | 15% discount | 25% discount |
| 11 | Super SWAN (as close to perfect dividend stock as exists on Wall Street) | fair value | 10% discount | 20% discount |
By looking at long-term fundamental trends. Cyclical companies (like Super SWAN 3M) sometimes go through periods of negative growth. But a quality company won’t see CBL style deterioration in cash flow or its balance sheet.
The above guidelines are what I personally use for my buy, strong buy and very strong buy recommendations. Buying an average quality or better company at historical fair value isn’t necessarily a bad idea, but I’m a deep value investor who likes to get a margin of safety that factors in a company’s risk profile.
But Simon trading at close to a 20% discount to historical fair value makes it a very strong buy today and its latest earnings prove this. I can’t tell you when Simon will return to its fair value of $199 (which grows over time). But I can tell you that as long as this REIT continues to execute brilliantly and grow its cash flow and dividends then it will eventually revert to historical valuation multiples.
That’s why the REIT is capable of 11% to 19% CAGR total returns over the next five years and is one of our highest conviction high-yield ideas right now.
Step 4: Rebalancing
Once you have a good long-term plan in place for your needs you need to periodically rebalance because market rallies can cause you to become overweight equities creating higher volatility risk (which can make it emotionally untenable to stick to your plan).
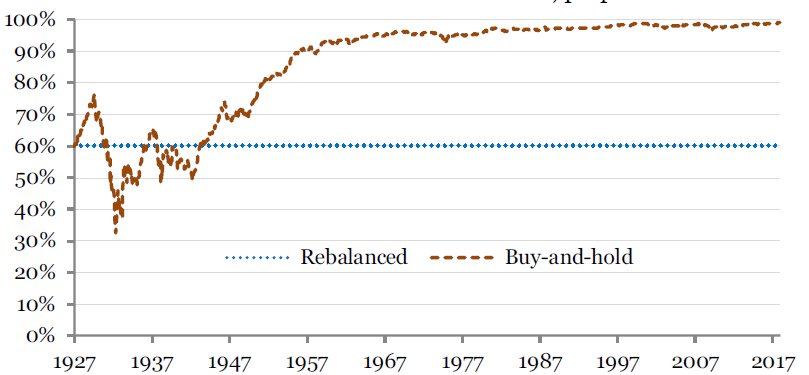
(Source: Duke University)
A 60/40 balanced portfolio in 1927 would have become almost all stock weighted by 2017 because over the long-term stocks are the best performing asset class.
However, you don’t want to overdo it with rebalancing either, obsessively selling every month to keep your asset allocation fixed.
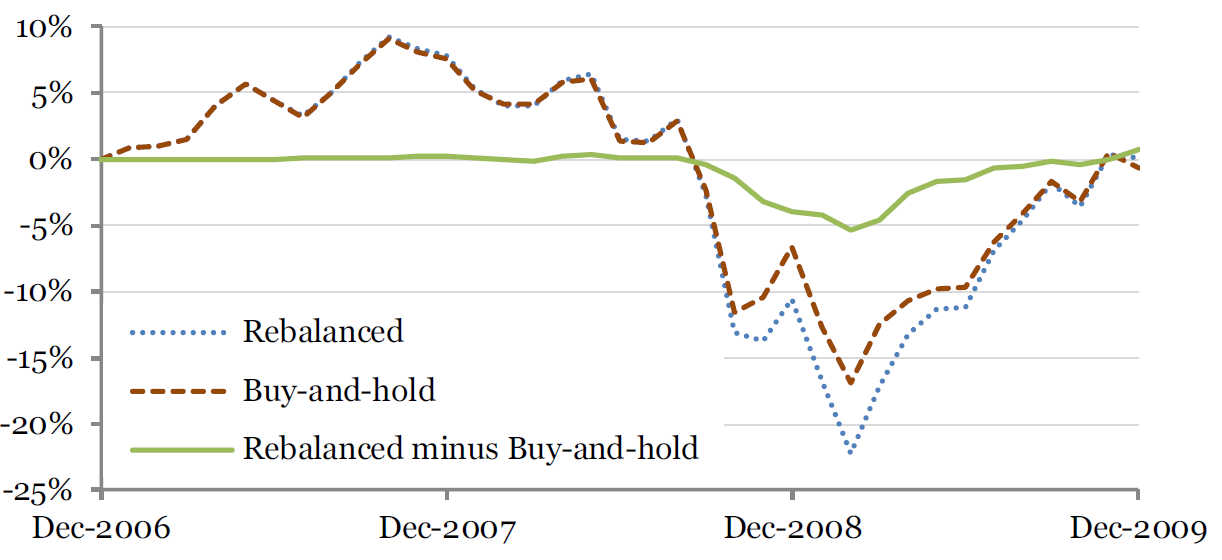
(Source: Duke University)
During the Great Recession, monthly rebalancing would have resulted in 20% worst peak declines (5%) and those would have been realized losses, compared to buy and hold investors who saw temporary declines that were reversed by the end of 2009.
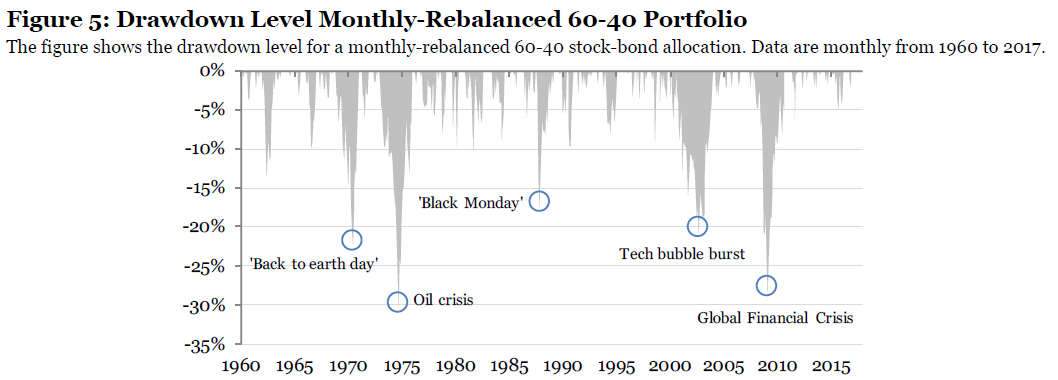
(Source: Duke University)
Similarly, monthly rebalancing would have led to larger and often permanent losses during various turbulent times in market history.
The idea behind rebalancing is to do it logically, selling overvalued assets (like stocks during strong rallies) when they become too much of your portfolio. Monthly rebalancing during corrections and bear markets would mean selling stocks at losses to buy bonds which have appreciated in value (and possibly become overvalued).
In other words, while not rebalancing at all can be a big mistake, so can rebalancing too often. Rebalancing every 6 to 12 months is one rule of thumb, and I personally recommend a nuanced and tactile approach.
- rebalance every 12 months, preferably on a fixed schedule
- BUT also leave room for judgment and don’t rebalance during a market downturn or unless stocks you become overweight in stocks to a level that exceeds your risk tolerance
The best performing pensions have ranges for their asset allocations such as 50% to 70% for stocks and 30% to 50% for bonds (they generally use slightly different asset classes but the point is the same). As Tom Phelps wrote in 100 to 1 in the Stock Market “fortunes are made by buying right and holding on.”
Which is why you need to be careful not to get too rebalancing happy, and thus defeating the point of this practice. The idea behind proper portfolio construction is that you can rest easy knowing that your plan will protect your wealth and achieve your long-term goals despite corrections.
“Far more money has been lost by investors preparing for corrections, or trying to anticipate corrections than has been lost in corrections themselves.” – Peter Lynch
I personally rebalance once per year via a “spring cleaning” that includes adjusting my holdings via a comprehensive plan that fits my needs. My last rebalancing was at the start of June when I sold 40% of Enbridge (ENB), which DK owns in two of our portfolios.
That wasn’t because ENB was overvalued (it’s very undervalued) but I sold 40% of my position at a 10% gain in order to move closer to my long-term risk management goals. That included
- lowering my exposure to midstream (from 26% to 20%)
- reducing ENB to 5% of my portfolio
- filling out my positions in MLPs Energy Transfer (ET) and MPLX (MPLX) to 5% of my portfolio
- opening up room to opportunistically buy more of those two-level 8 quality midstreams (2 of our 16 safe midstreams worth owning) which I did by adding $1,000 of MPLX to my retirement portfolio when the great 2019 summer natural gas crash sent its to fresh 52-week lows
- Funded a major increase in my British American Tobacco (BTI) position, diversifying me by sector and increasing my defensive exposure
- Overall increased my portfolio’s safe annual income (by about $200 per year) and boosted its long-term total return potential
Why do I only consider rebalancing once per year to be a reasonable approach?
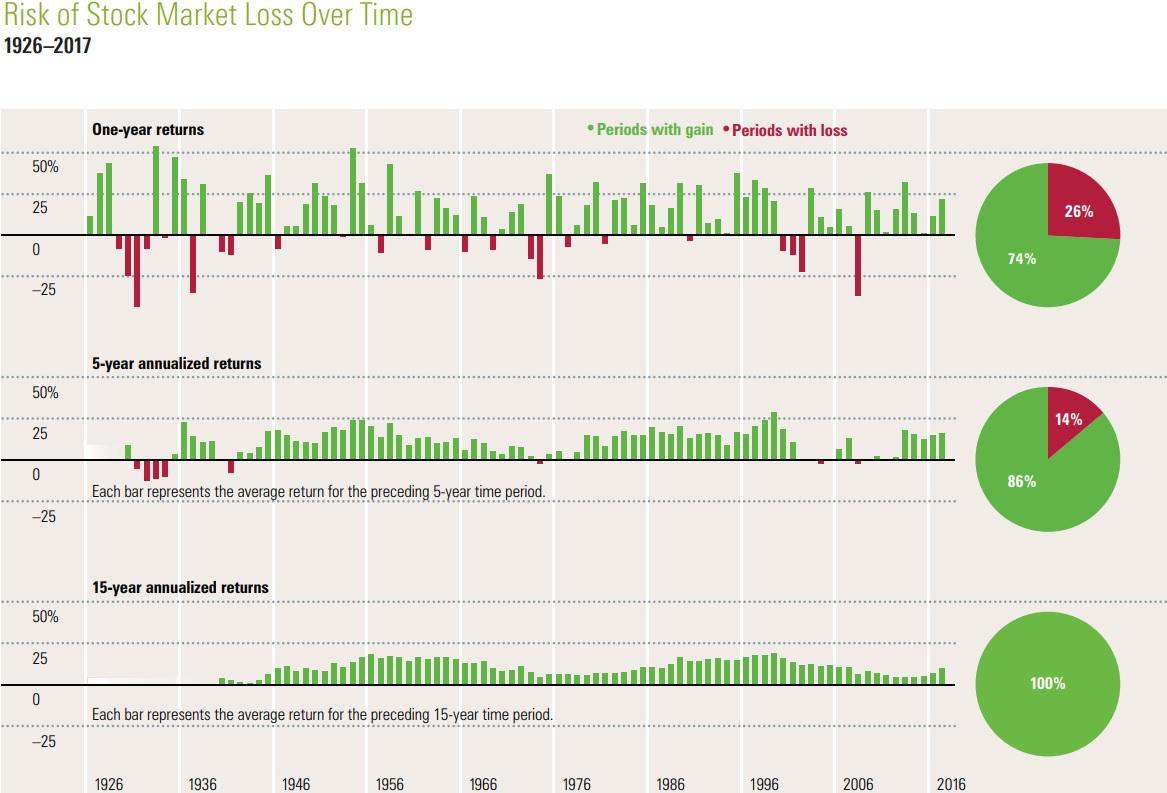
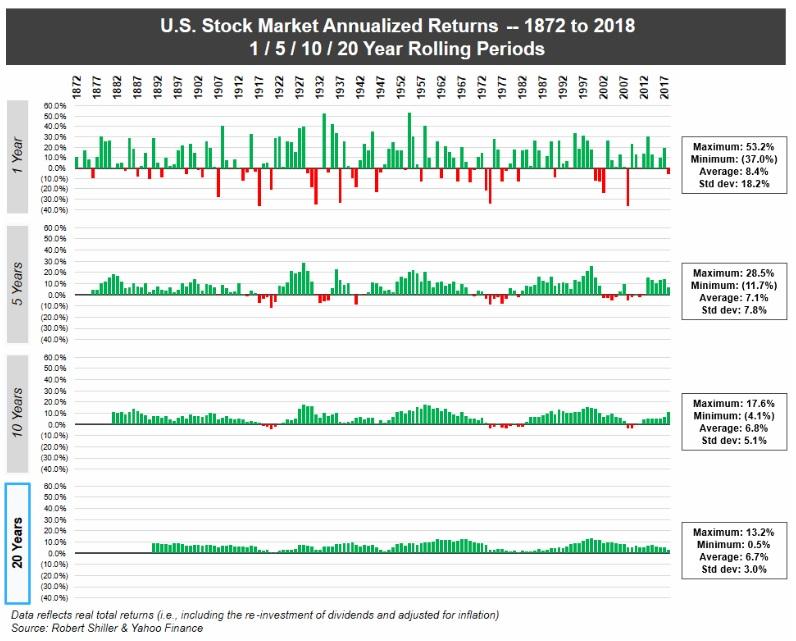
Because from 1926 to 2018 the S&P 500 went up 73% of years. And since 1945 stocks have close positive in 78% of years.
Since 1872 stocks have never experienced a rolling 20-year loss, not even measured from 1929 to 1949 (the Great Depression which saw a 90% peak decline, the worst in US market history).
In other words, long-term investing in stocks is the highest probability strategy for exponentially growing your income and wealth over time. So you want to take a nuanced approach that ensures your asset allocation doesn’t get too far outside your personal risk tolerance/long-term plan BUT also don’t neutralize the power of dividend stocks to help you meet your goals either.
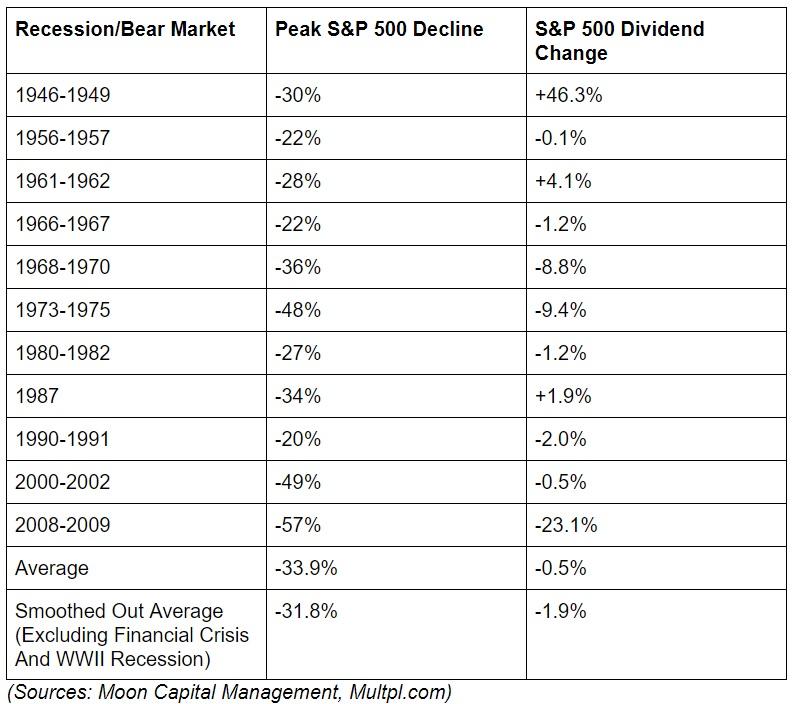
Speaking of dividends, one big reason I’m such a fan of this strategy is that outside of extreme outliers (like the Financial Crisis that saw banks and REITs slash dividends en masse) US corporations tend not to cut dividends unless absolutely necessary.
Which is why dividends tend to barely fall during recessions, despite stocks declining a significant amount.
Mind you that’s for the S&P 500 as a whole, which represents about average quality companies (level 7/11 on my quality scale). The reason I only recommend level 8 above average quality income stocks (and own just 1 level 7 speculative buy as 5% of my portfolio) is because I want to lower the risk of my portfolio income dropping during any future downturns/bear markets.
Depending on your risk tolerance and needs, you can get even more conservative, such as by owning nothing but level 11 quality Super SWANs or dividend aristocrats and kings.
- Dividend Kings Valuation/Total Return Potential list
- Dividend Aristocrat Valuation/Total Return Potential list
Here are our valuation/total return potential lists for the kings and aristocrats (there are about 10 nonoverlapping companies between the two lists). The Super SWAN list (45 companies) is coming next week, which will show the historical fair values for all level 11/11 quality companies, their realistic annual total return potential over the next five years, and will bold the ones that Fortress owns.
Some of our Fortress holdings are highly overvalued (as Chuck Carnevale pointed out in a recent article), and are scheduled for annual rebalancing in July 2020. That’s barring a rate cut euphoria induced meltup in which case we have the discretion to rebalance earlier.
Step 5: Ignore The Noise And Stick To Your Plan
One of the best financial commentators, Morgan Housel recently pointed out two important things.
“part of why predicting something like the economy is difficult is because you have private-school-educated economists earning seven figures trying to understand the spending behaviors of a total population, 78% of whom live paycheck to paycheck.”
“You don’t get on TV, or invited to industry conferences, or big book deals, for predicting average outcomes. Pundits get paid for sitting three standard deviations away from sane analysts. Take away that incentive and you’d find that many extremists – even respected ones – are merely opportunists.”
This is why the mainstream financial media (like CNBC, Fox Business or Bloomberg TV) frequently have on people like John Hussman, the famed permabear who’s been predicting a 50% to 70% market crash since 2010.
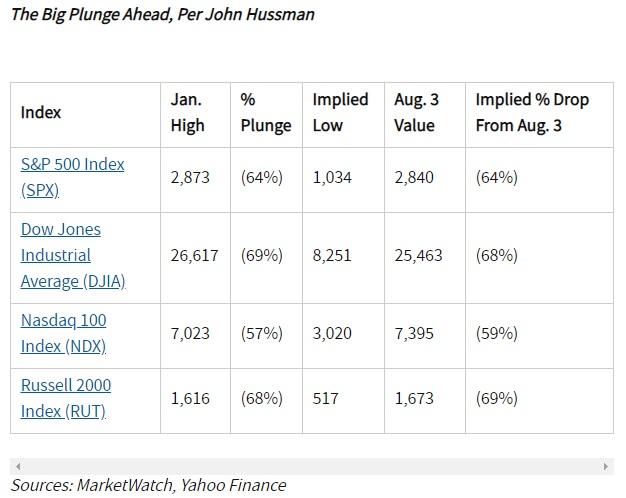 Back in August 2018 Hussman, who made a fortune shorting the Great Recession, predicted that the Dow was set to fall almost 70% and small caps (the Russell 2000) would join it in market hell.
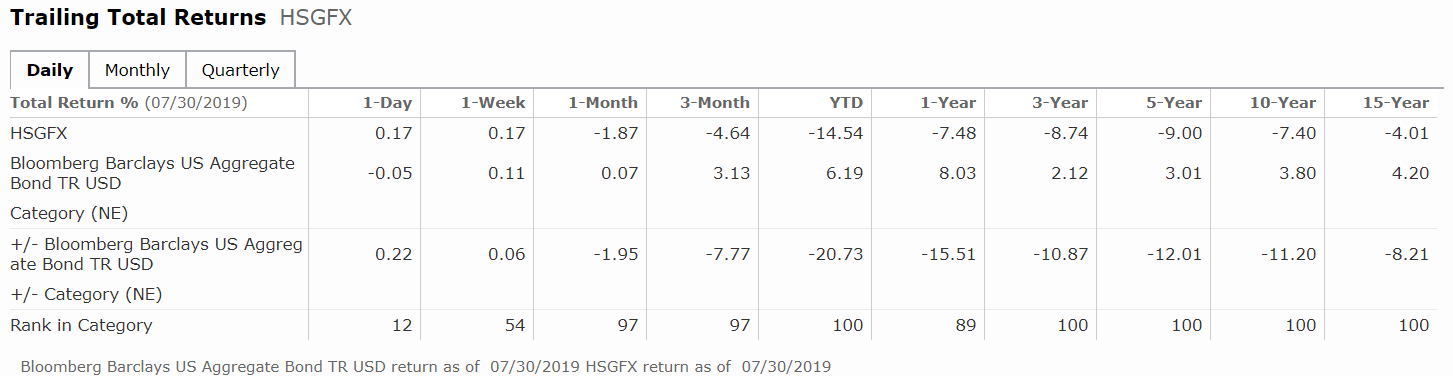
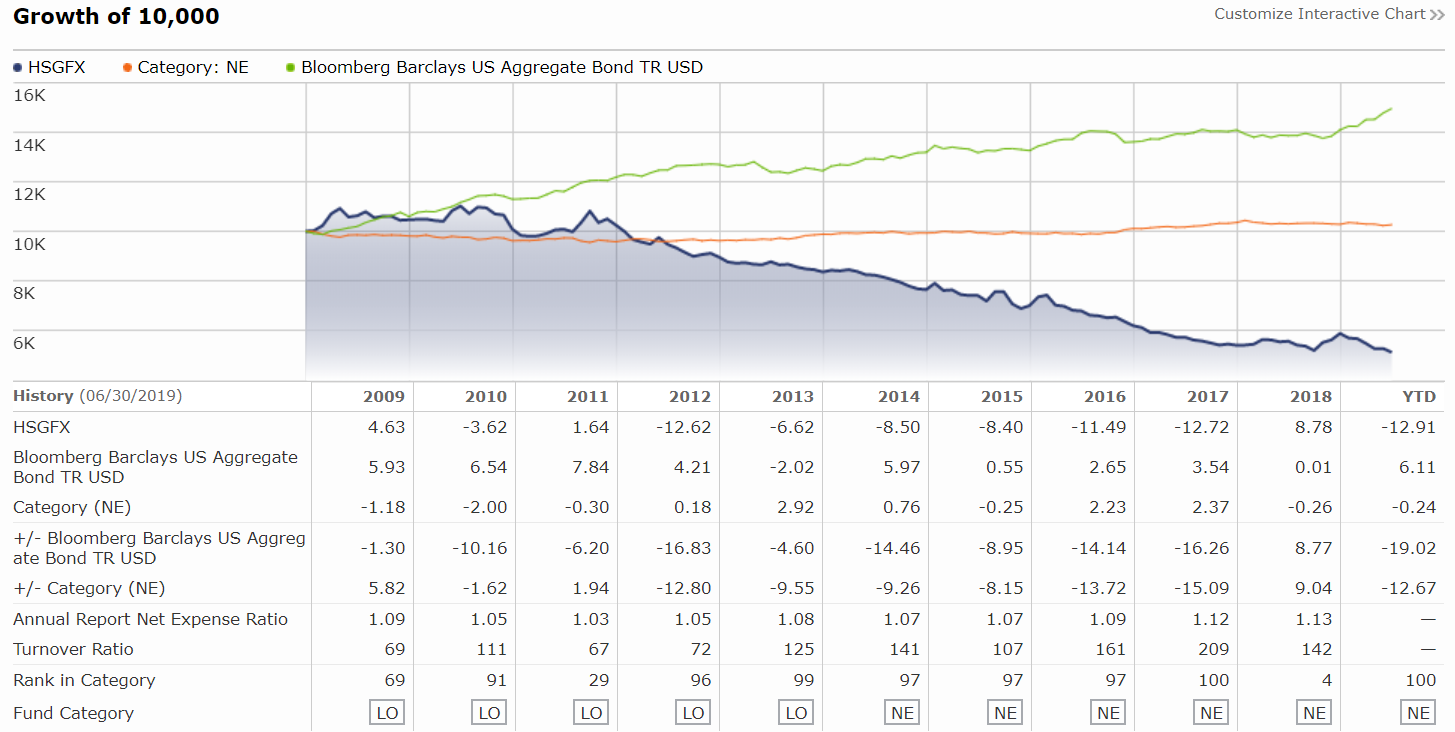
(Source: Morningstar)
Here’s how the Hussman Strategic Growth Fund (which had $6.7 billion in assets in 2010 but now has under $300 million) has performed over the last 15 years. Mind you that’s including the strong gains that made John Hussman so famous during the 2008 collapse. This 1 star Morningstar rated hedge fund has delivered -4% CAGR total returns over the past 15 years thanks to betting against the US economy and stock market via shorting, gold and bearish option writing.
Back in 2011 famous bond kings bet tens of billions that QE induced inflation would send long-term rates soaring and cause bonds to crash. They spoke with incredible certainty and a lot of people watching them on TV (talking their own books) joined them in betting against fixed income in what turned out to be an amazing decade for bonds.
Another famous permabear is former Reagan White House Budget Director David Stockman, who the media never tires of parading out to predict a market meltdown. That includes in:
- 2012: “I wouldn’t touch the stock market with a 100-foot pole“
- 2013: “The United States is broke — fiscally, morally, intellectually“
- 2013: “An unexpected dark shocker and black swan event looms by the end of the year“
- 2015: “Stocks are a disaster waiting to happen“
- 2016: “stocks have already crashed in 6 of the world’s 8 largest economies“
- 2017: “the crash with be violent“
- 2018: “market crash will be a doozy“
- 2018: “unhinged Whitehouse to cause a stock market crash“
Other notable permabears that are frequently media darlings (especially during corrections) include:
- Marc Faber, author of the of The Gloom, Boom & Doom Report
- Nouriel Roubini
- Peter Schiff
- Stephen Roach
- David Tice
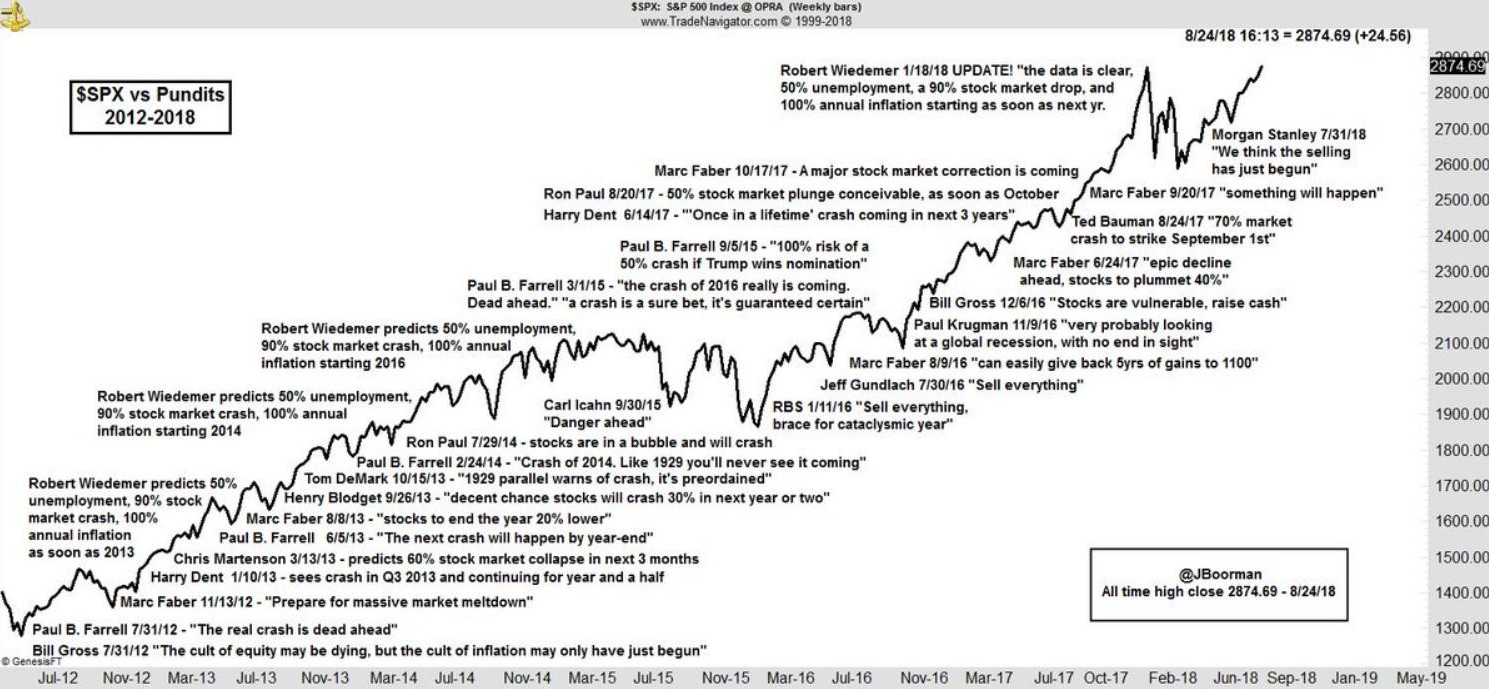
These doomsday prophets have been warning of calamity, always touting real risks and plausible-sounding worst-case scenarios, for a decade in which the market has more than quadrupled.
As Dan Gardner, author of The Science of Fear, explains: “Fear sells. Fear makes money. The countless companies and consultants in the business of protecting the fearful from whatever they may fear know it only too well. The more fear, the better the sales.”
Peter Lynch, one of the greatest investors of all time famously said: “in this business, if you’re good you’re right six times out of ten.”
You should never take advice from anyone that doesn’t both share your overall time horizon (and general investing strategy) AND speaks in terms of probabilities since that is the only true thing on Wall Street.
Whenever you here ANYONE talking with certainty about finance (stocks, bonds, interest rates, the economy) realize that they are either
- ignorant (don’t understand the probabilistic nature of finance)
- idiots (understand that all investing is probabilistic but act as if it isn’t)
- liars (opportunists trying to get on TV or sell books)
Bottom Line: A SWAN Retirement Portfolio Requires A Logical And Probability-Based Strategy That’s Most Likely To Meet Your Long-Term Needs
As Chuck Carnevale has been pointing out to his clients for decades (50 years of experience as an asset manager) proper planning is the true key to achieving your financial goals.
That planning must encompass every aspect of your life, beginning with budgeting and economizing on purchases to ensure you have discretionary savings to put to work.
It then proceeds to asset allocation that’s most likely to meet your long-term needs, but factoring in the fact that no one knows what the ideal future allocation is (use reasonable allocations that are likely to do well no matter what).
Stock selection, whether ETFs (for those without the time/ability/desire for stock picking) or individual companies, must always focus on capital preservation first. This is why Dividend Kings’ motto is quality first, valuation second and appropriate risk management always.
You don’t want to be suckered into value/yield traps thinking that some company trading at rock bottom multiples is a great buy, when in fact it’s trading at those levels because the business model is deteriorating and its cash flow (and stock price) might be going to zero.
I personally only ever recommend level 8/11 or higher above-average companies, because these are the least likely to cut their dividends during recession (even average companies tend to avoid cuts except in exceptionally severe economic downturns).
Once you’ve constructed your portfolio, make sure to rebalance periodically, but not so often that you’ll realize short-term losses during pullbacks/corrections and thus neutralize the benefits of a properly balanced portfolio.
Rebalancing once every 6 to 12 months is the rule of thumb, but I personally recommend and use 12-month rebalancing because since 1945 the market goes up in 78% of years (73% since 1926 including the Great Depression).
But once you’ve built a great retirement portfolio, that’s likely to achieve your goals, you need to ignore the noise that comes out of the mainstream financial media. TV networks like CNBC have to fill airtime and are likely to do so with extreme views, including permabulls and permabears making grandiose, confident and almost always wrong predictions about imminent crashes and rallies.
Remember that the difference between perfect market timing and the absolute worst possible market timing is minimal, because a sound long-term strategy, consistently executed on with discipline and patience, will likely overcome virtually all the risks we face today and in the years and decades to come.


